When Should You Stop an Ad Test? Separate Risk Limits From Evidence
A dashboard showing declining ROAS doesn't tell you whether to cut budget or change creative. Premature decisions based on incomplete signals waste more than inaction does.
A dashboard showing declining ROAS doesn't tell you whether to cut budget or change creative. Premature decisions based on incomplete signals waste more than inaction does.
Merchants facing ROAS decline in active campaigns face genuine uncertainty: Is this creative fatigue requiring new assets? Audience saturation demanding fresh targeting? Platform algorithm changes needing adaptation? Or just normal variance requiring patience?
Making the wrong decision—killing a winner too early or holding onto a loser too long—costs more than the performance dip itself. This article provides a diagnostic framework for separating signal from noise, with pre-commit decision rules that prevent emotional reactions.
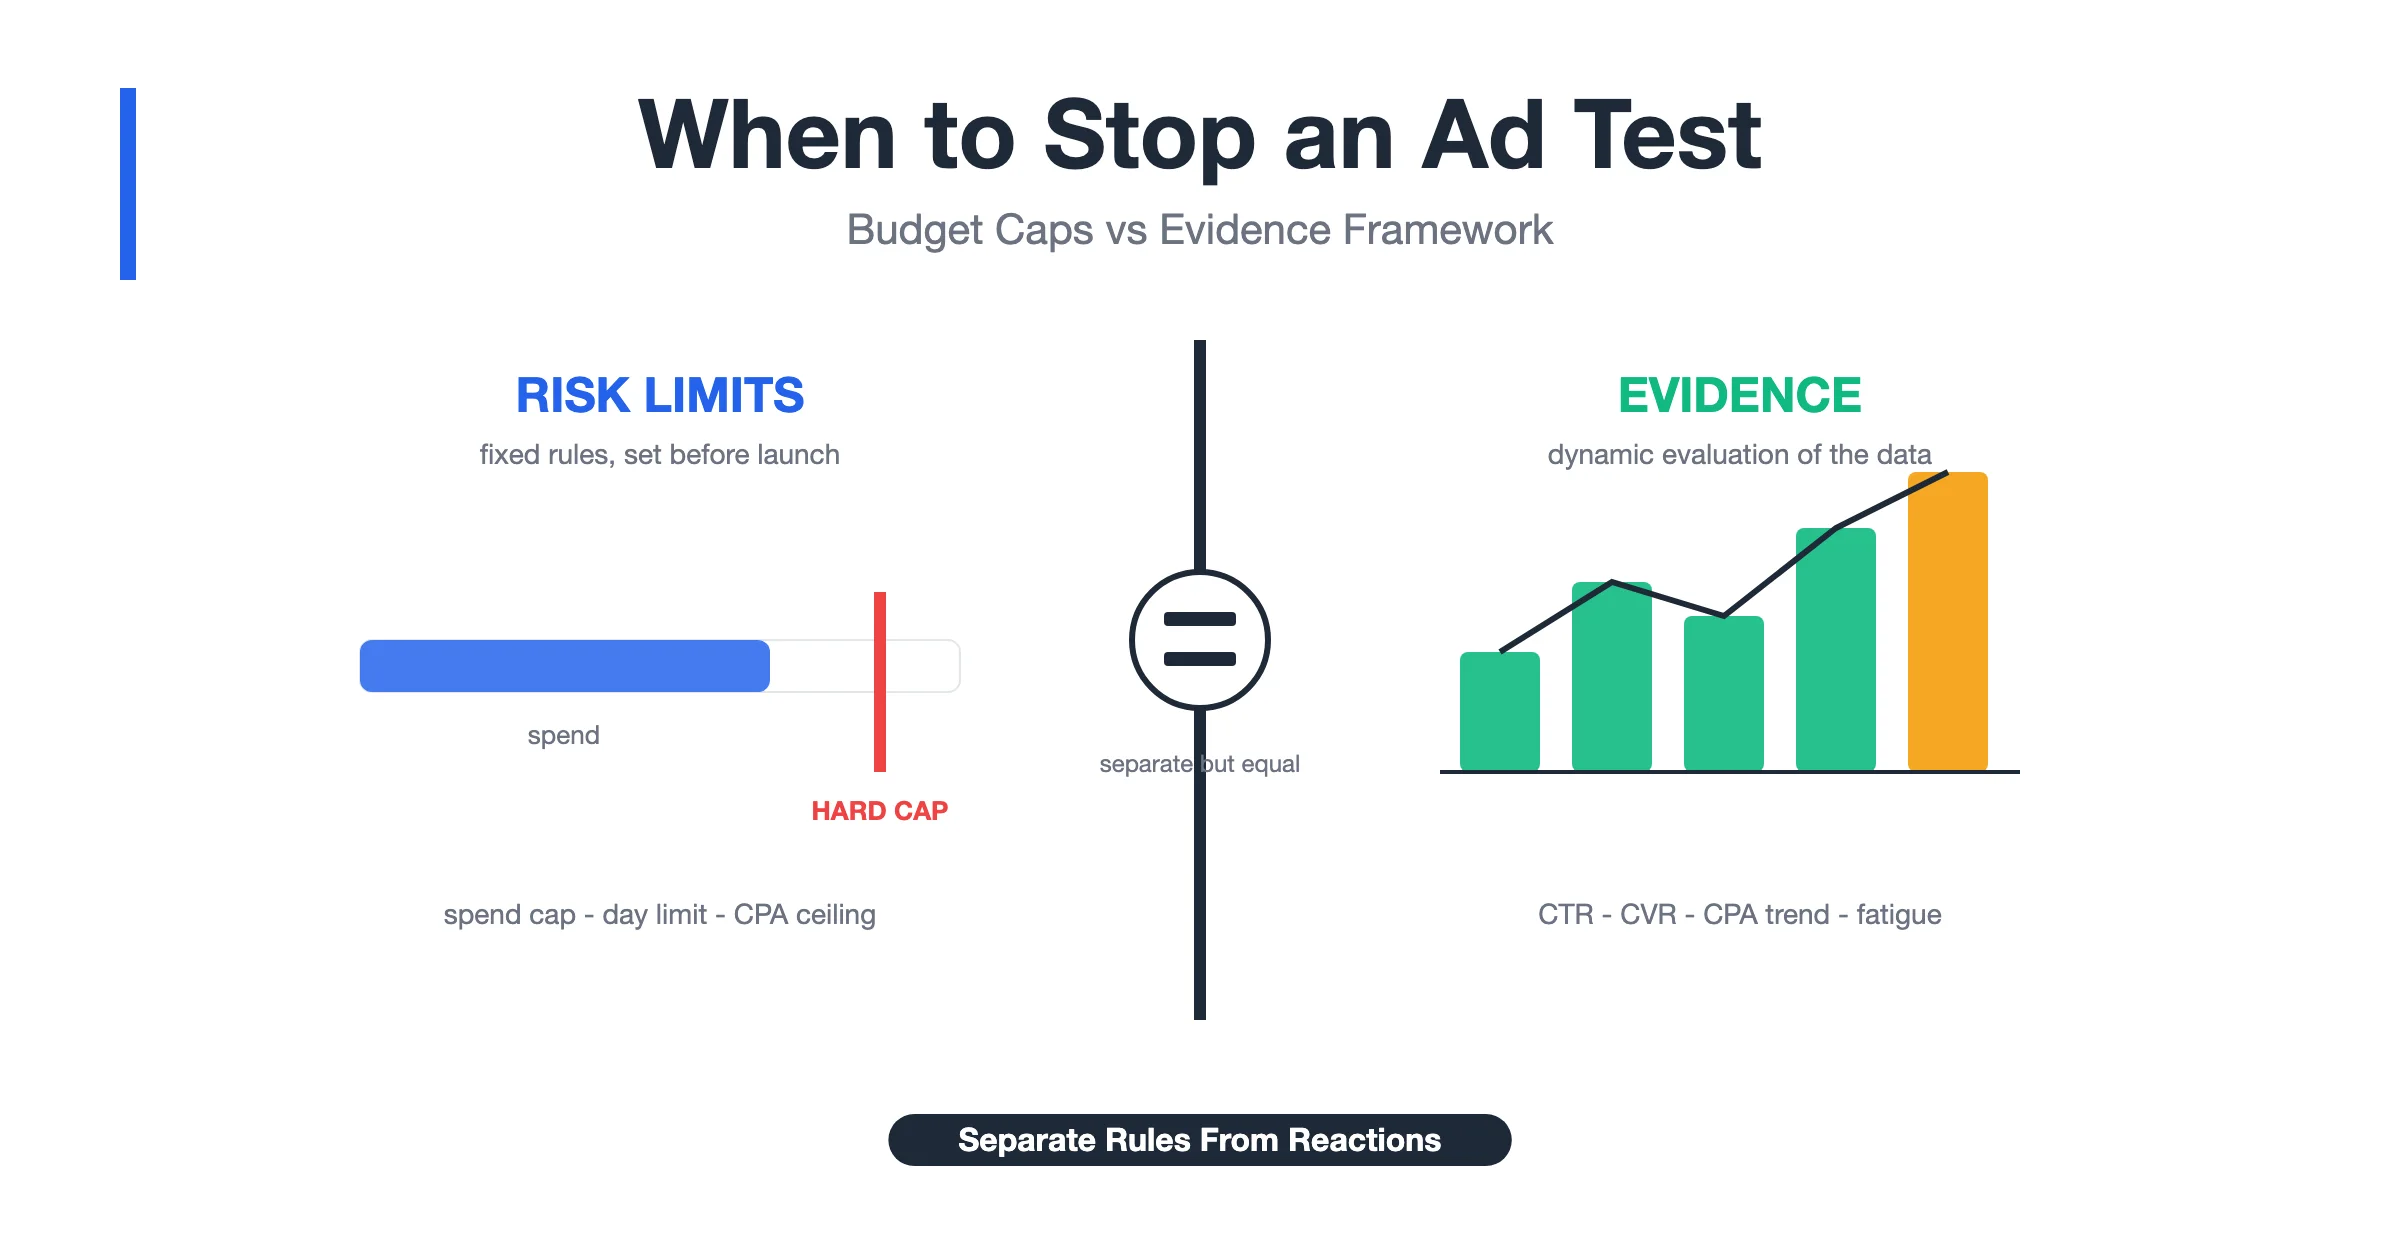
The Decision Framework: Evidence vs Risk Limits
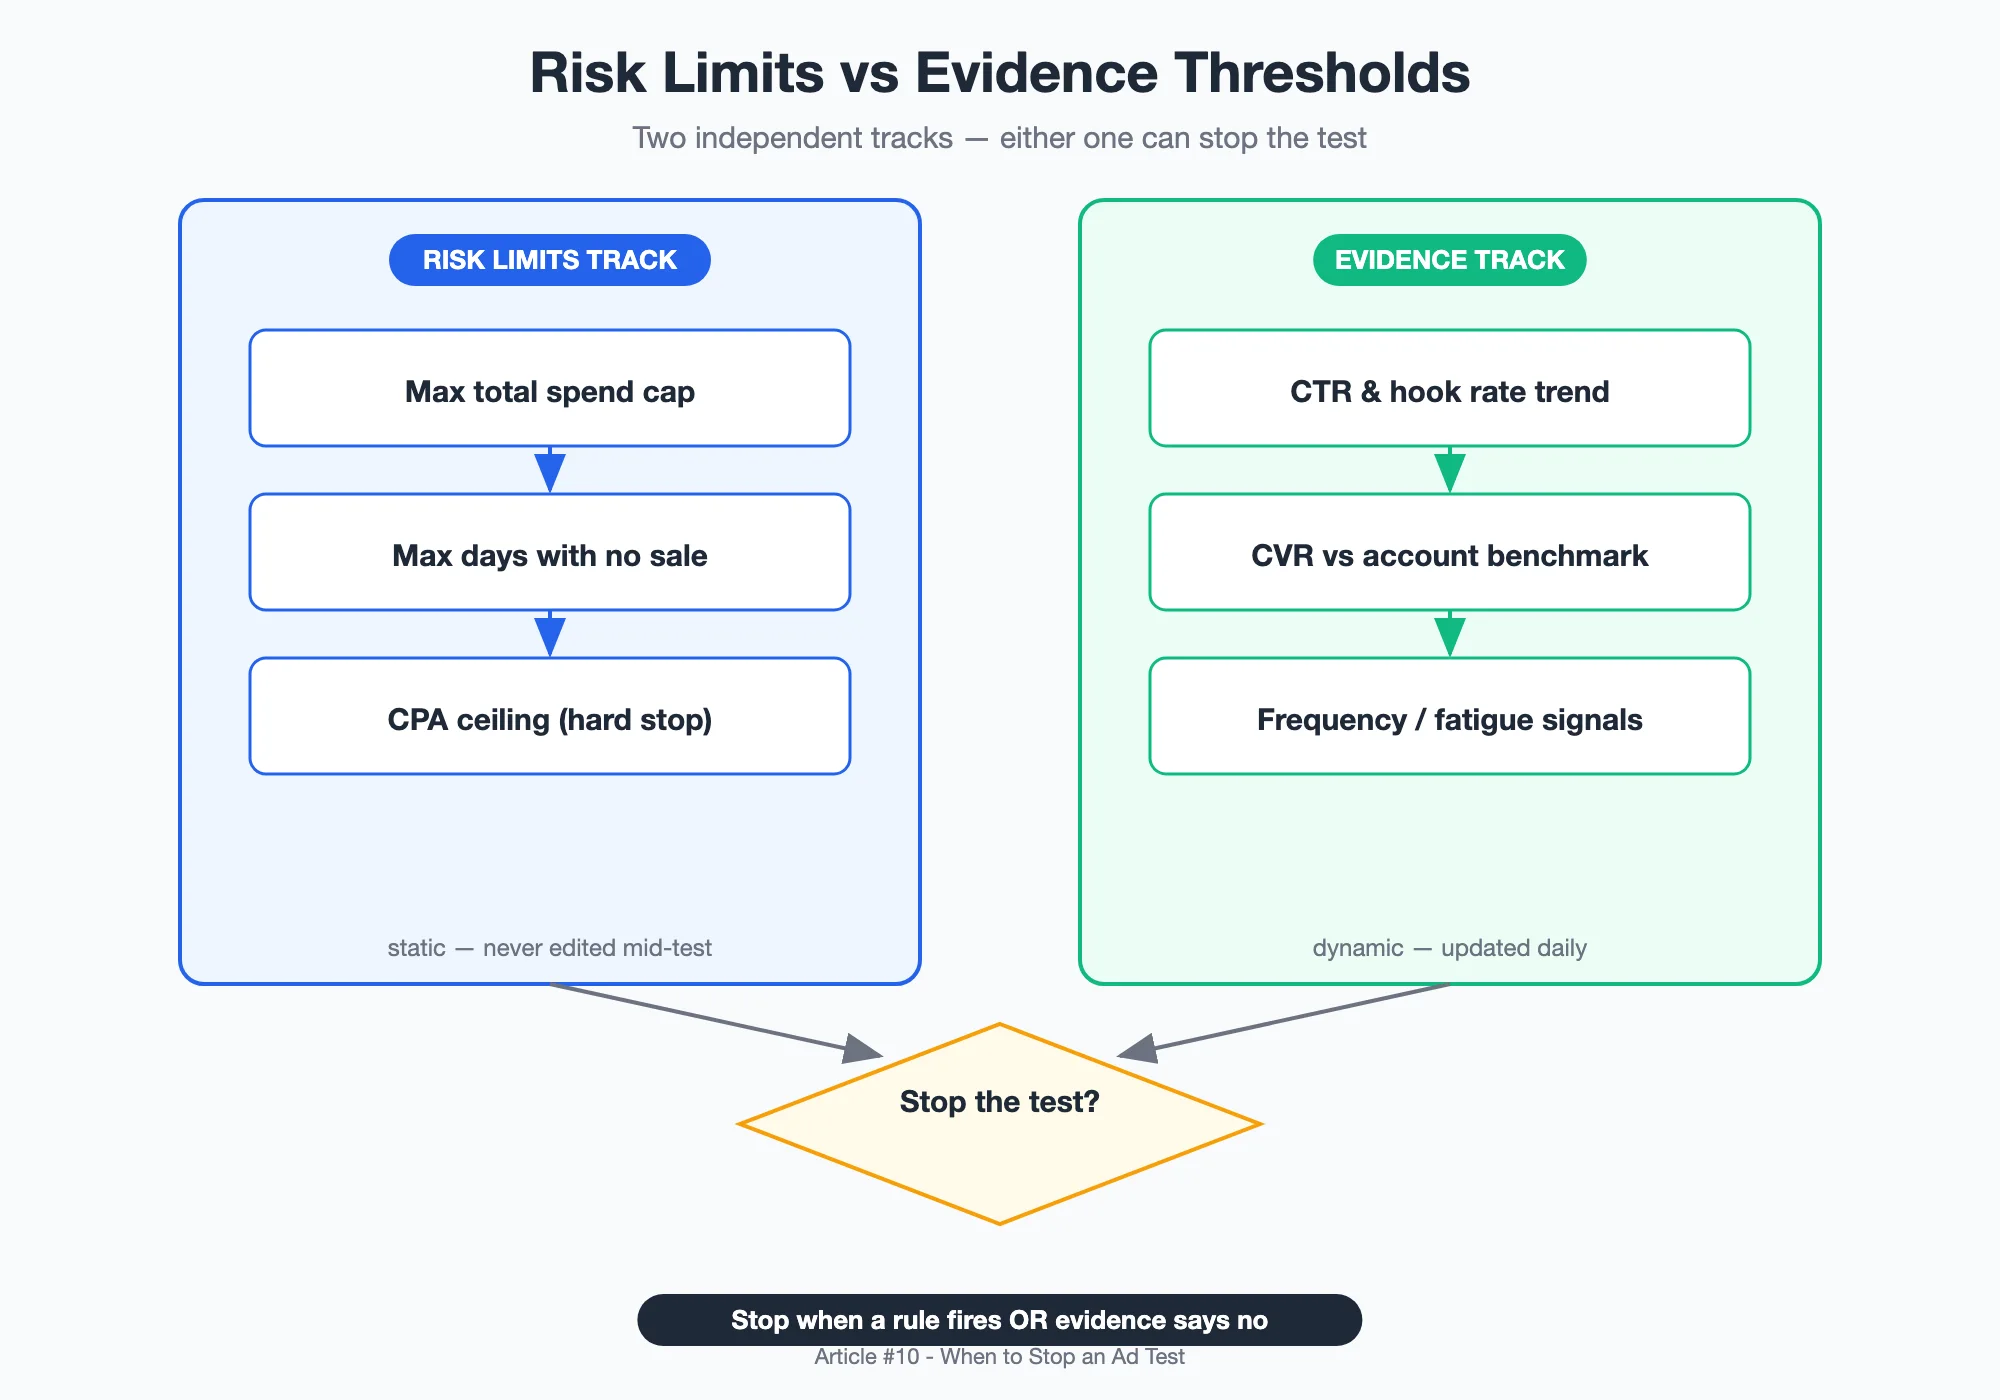
Successful testing requires two separate decision systems:
Risk limits (budget caps): Maximum spend per variant before automatic pause. These are set BEFORE testing begins and don't change based on performance data.
Evidence thresholds: Performance metrics indicating whether to continue or kill. These are evaluated DURING testing and guide continuation decisions.
Most merchants confuse these two systems. They let evidence override risk limits ("This is almost at budget cap but performing well, so I'll go over") or let risk limits override evidence ("At 80% of budget with decent ROAS, I should stop and learn"). Both approaches create suboptimal outcomes.
Correct approach:
- Set hard budget caps that cannot be exceeded regardless of performance
- Evaluate evidence continuously but only make continuation decisions when approaching budget limit
- If hitting budget cap with strong performance, allocate additional budget strategically rather than violating cap
This separation prevents emotional decisions while maintaining discipline.
Diagnostic Flowchart for ROAS Decline
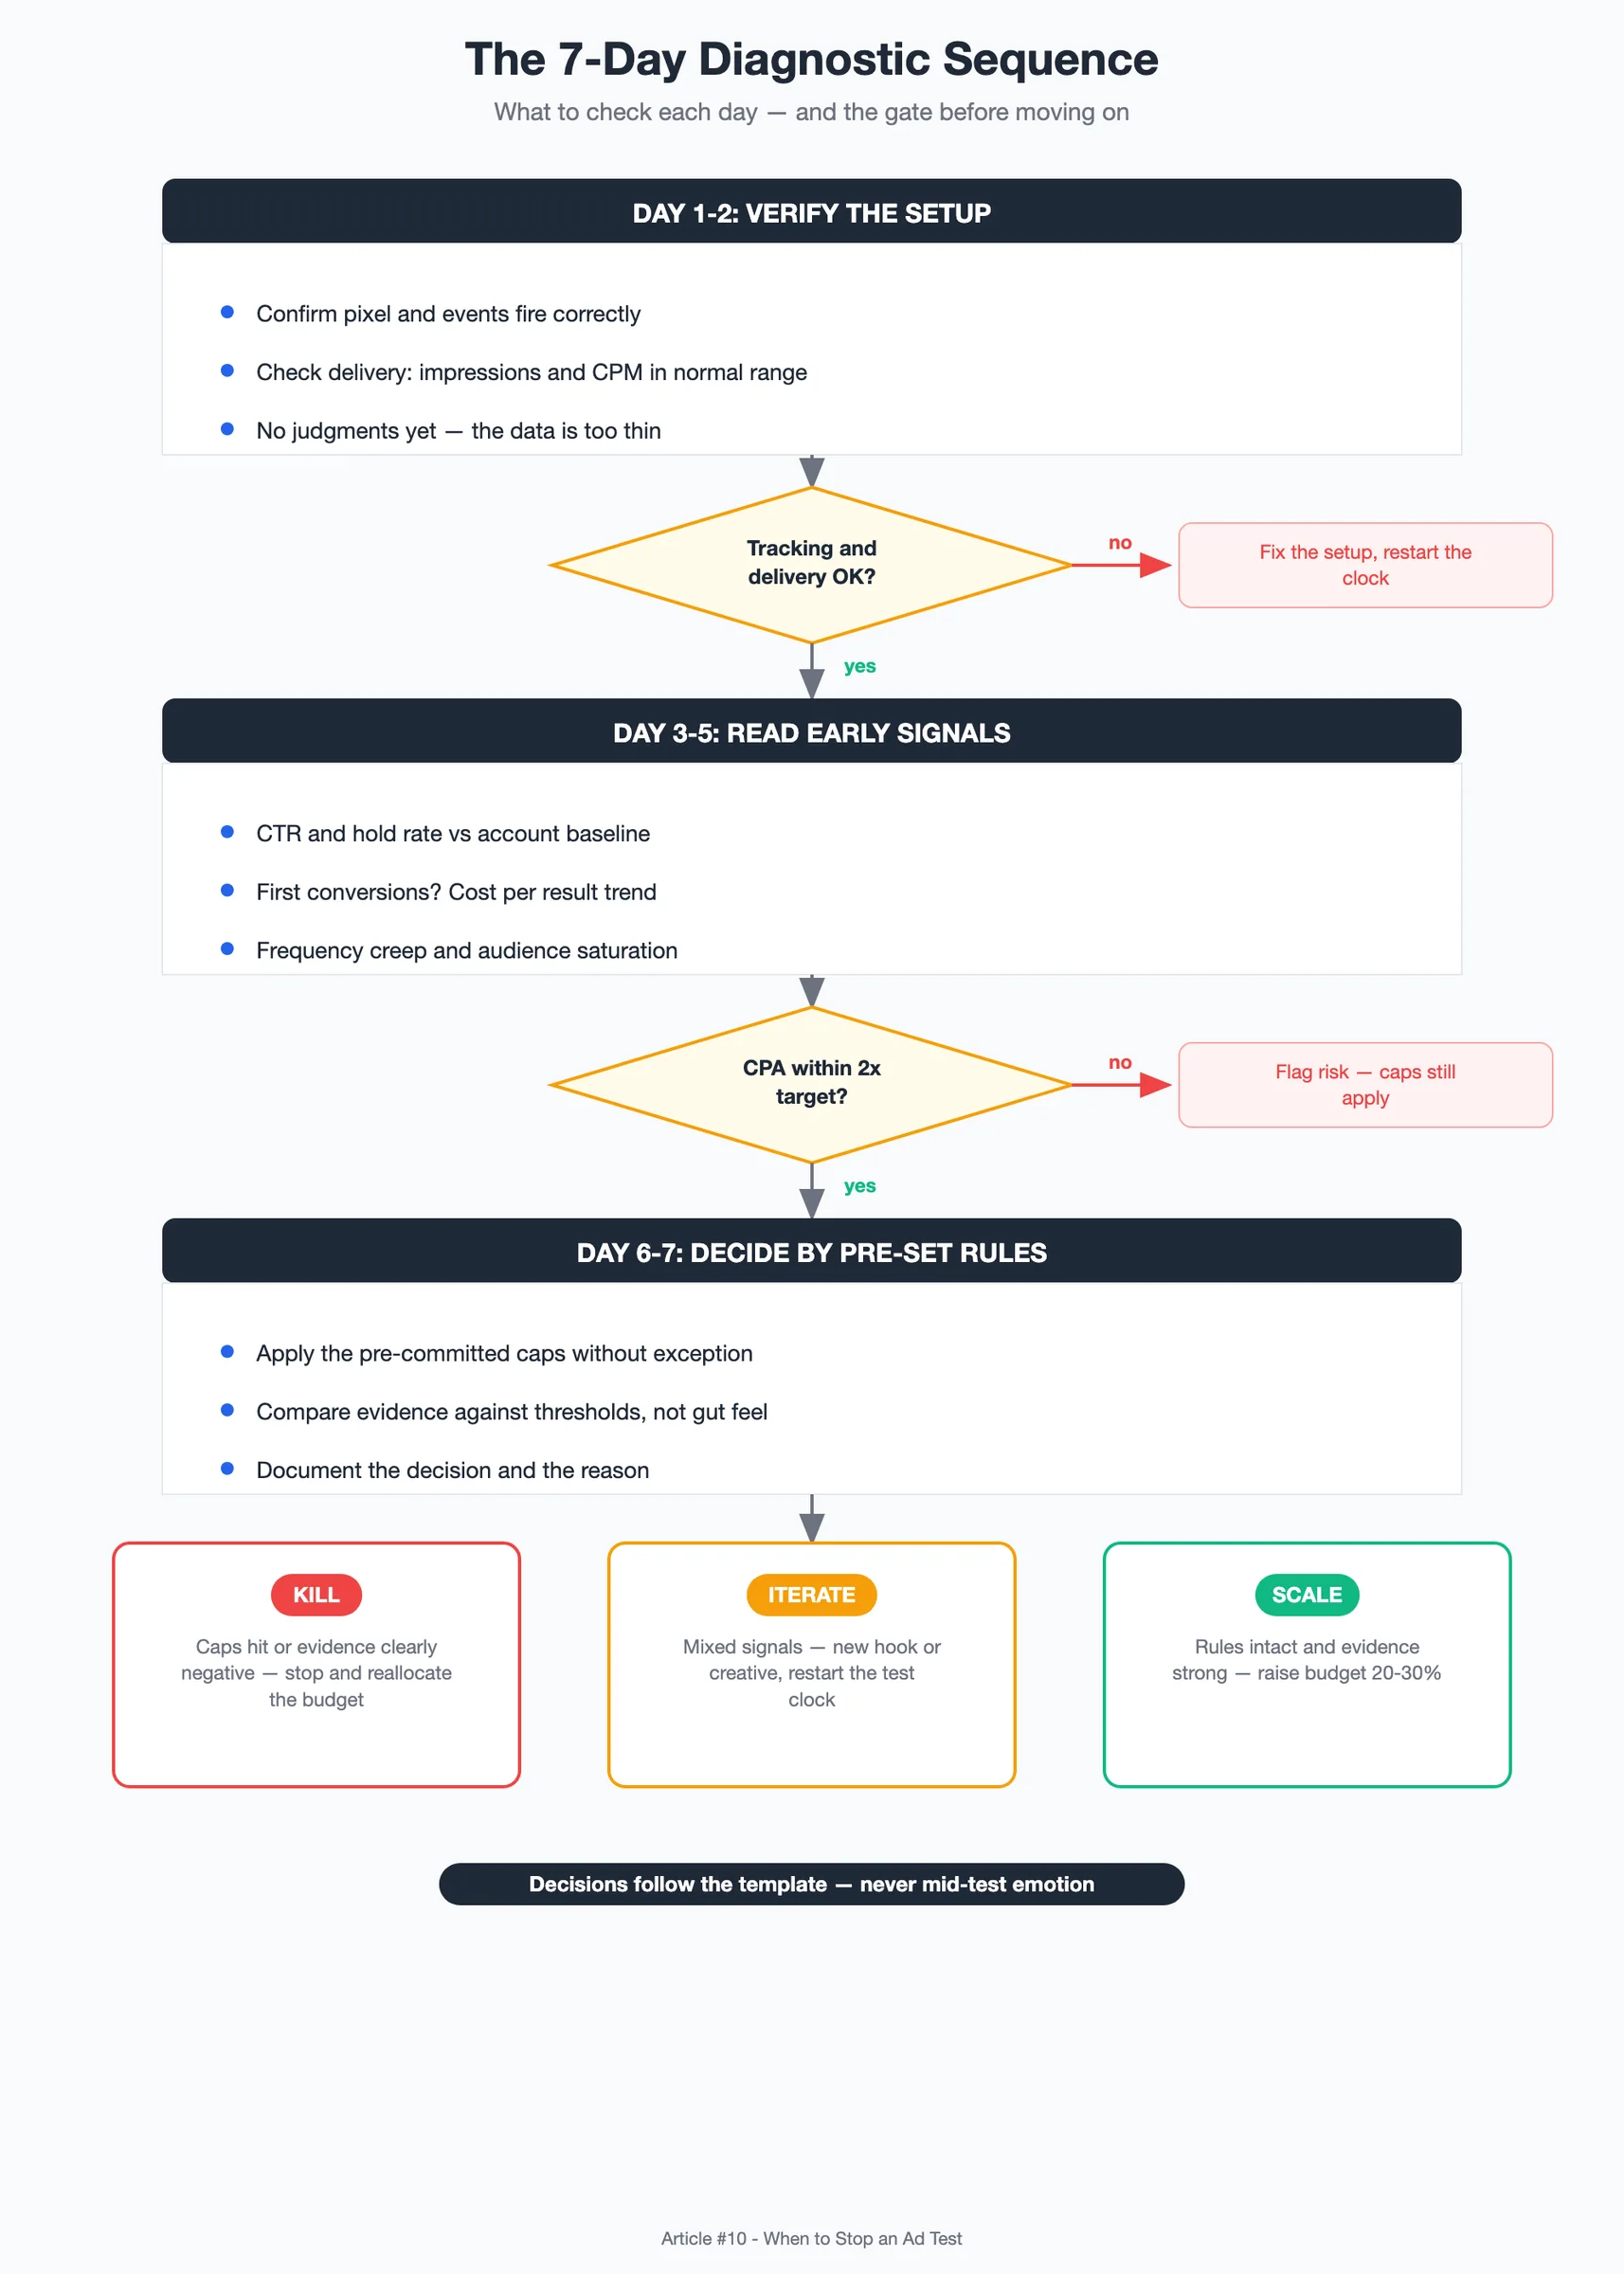
When ROAS declines, work through this diagnostic sequence before making any changes:
Step 1: Confirm Signal Isn't Noise (Days 1-2)
Check sample size: Are you evaluating based on fewer than 15 conversions? If yes, wait. Statistical noise dominates small samples.
Check attribution window: Has enough time passed for full attribution? 1-day click ROAS often improves over 7-day period as delayed conversions register.
Check external factors: Any holidays, promotions, or competitor activity affecting your category? Seasonal dips normal; don't overreact to expected variations.
Decision: If any of these apply, wait 2-3 more days before concluding trend is real.
Step 2: Identify Root Cause (Days 3-5)
Once confirming decline is real, diagnose cause:
Creative fatigue indicators:
- CTR declined 20%+ from campaign baseline
- Frequency increased >3x per week per user
- Completion rate dropping on video ads
- Positive comments/reviews decreasing
Audience saturation indicators:
- CPM increased 30%+ without platform-wide increase
- Reach plateaued despite budget increases
- New customer ratio declining sharply
- Duplicate conversions increasing
Platform algorithm changes:
- Industry-wide performance shifts reported by peers
- Meta/TikTok announcing policy or delivery changes
- Attribution model updates affecting reporting
Landing page issues:
- Site speed degraded
- Checkout errors reported by customers
- Inventory stockouts on promoted products
Decision: Match symptoms to root cause before implementing fixes. Don't swap creative if problem is audience saturation.
Step 3: Test Hypotheses (Days 6-7)
Before scaling interventions, validate with small budgets:
If creative fatigue suspected: Launch 2-3 new creatives at $50-100/day each. Compare performance against original after 3 days.
If audience saturation suspected: Test lookalike expansions or new interest clusters at $50-100/day. Measure incremental lift versus base campaign.
If platform changes suspected: Run A/B test with identical creative on slightly different audiences. Determine if issue universal or specific to one segment.
Decision: Only scale interventions after small-budget validation confirms hypothesis.
Pre-Commit Decision Rules Template
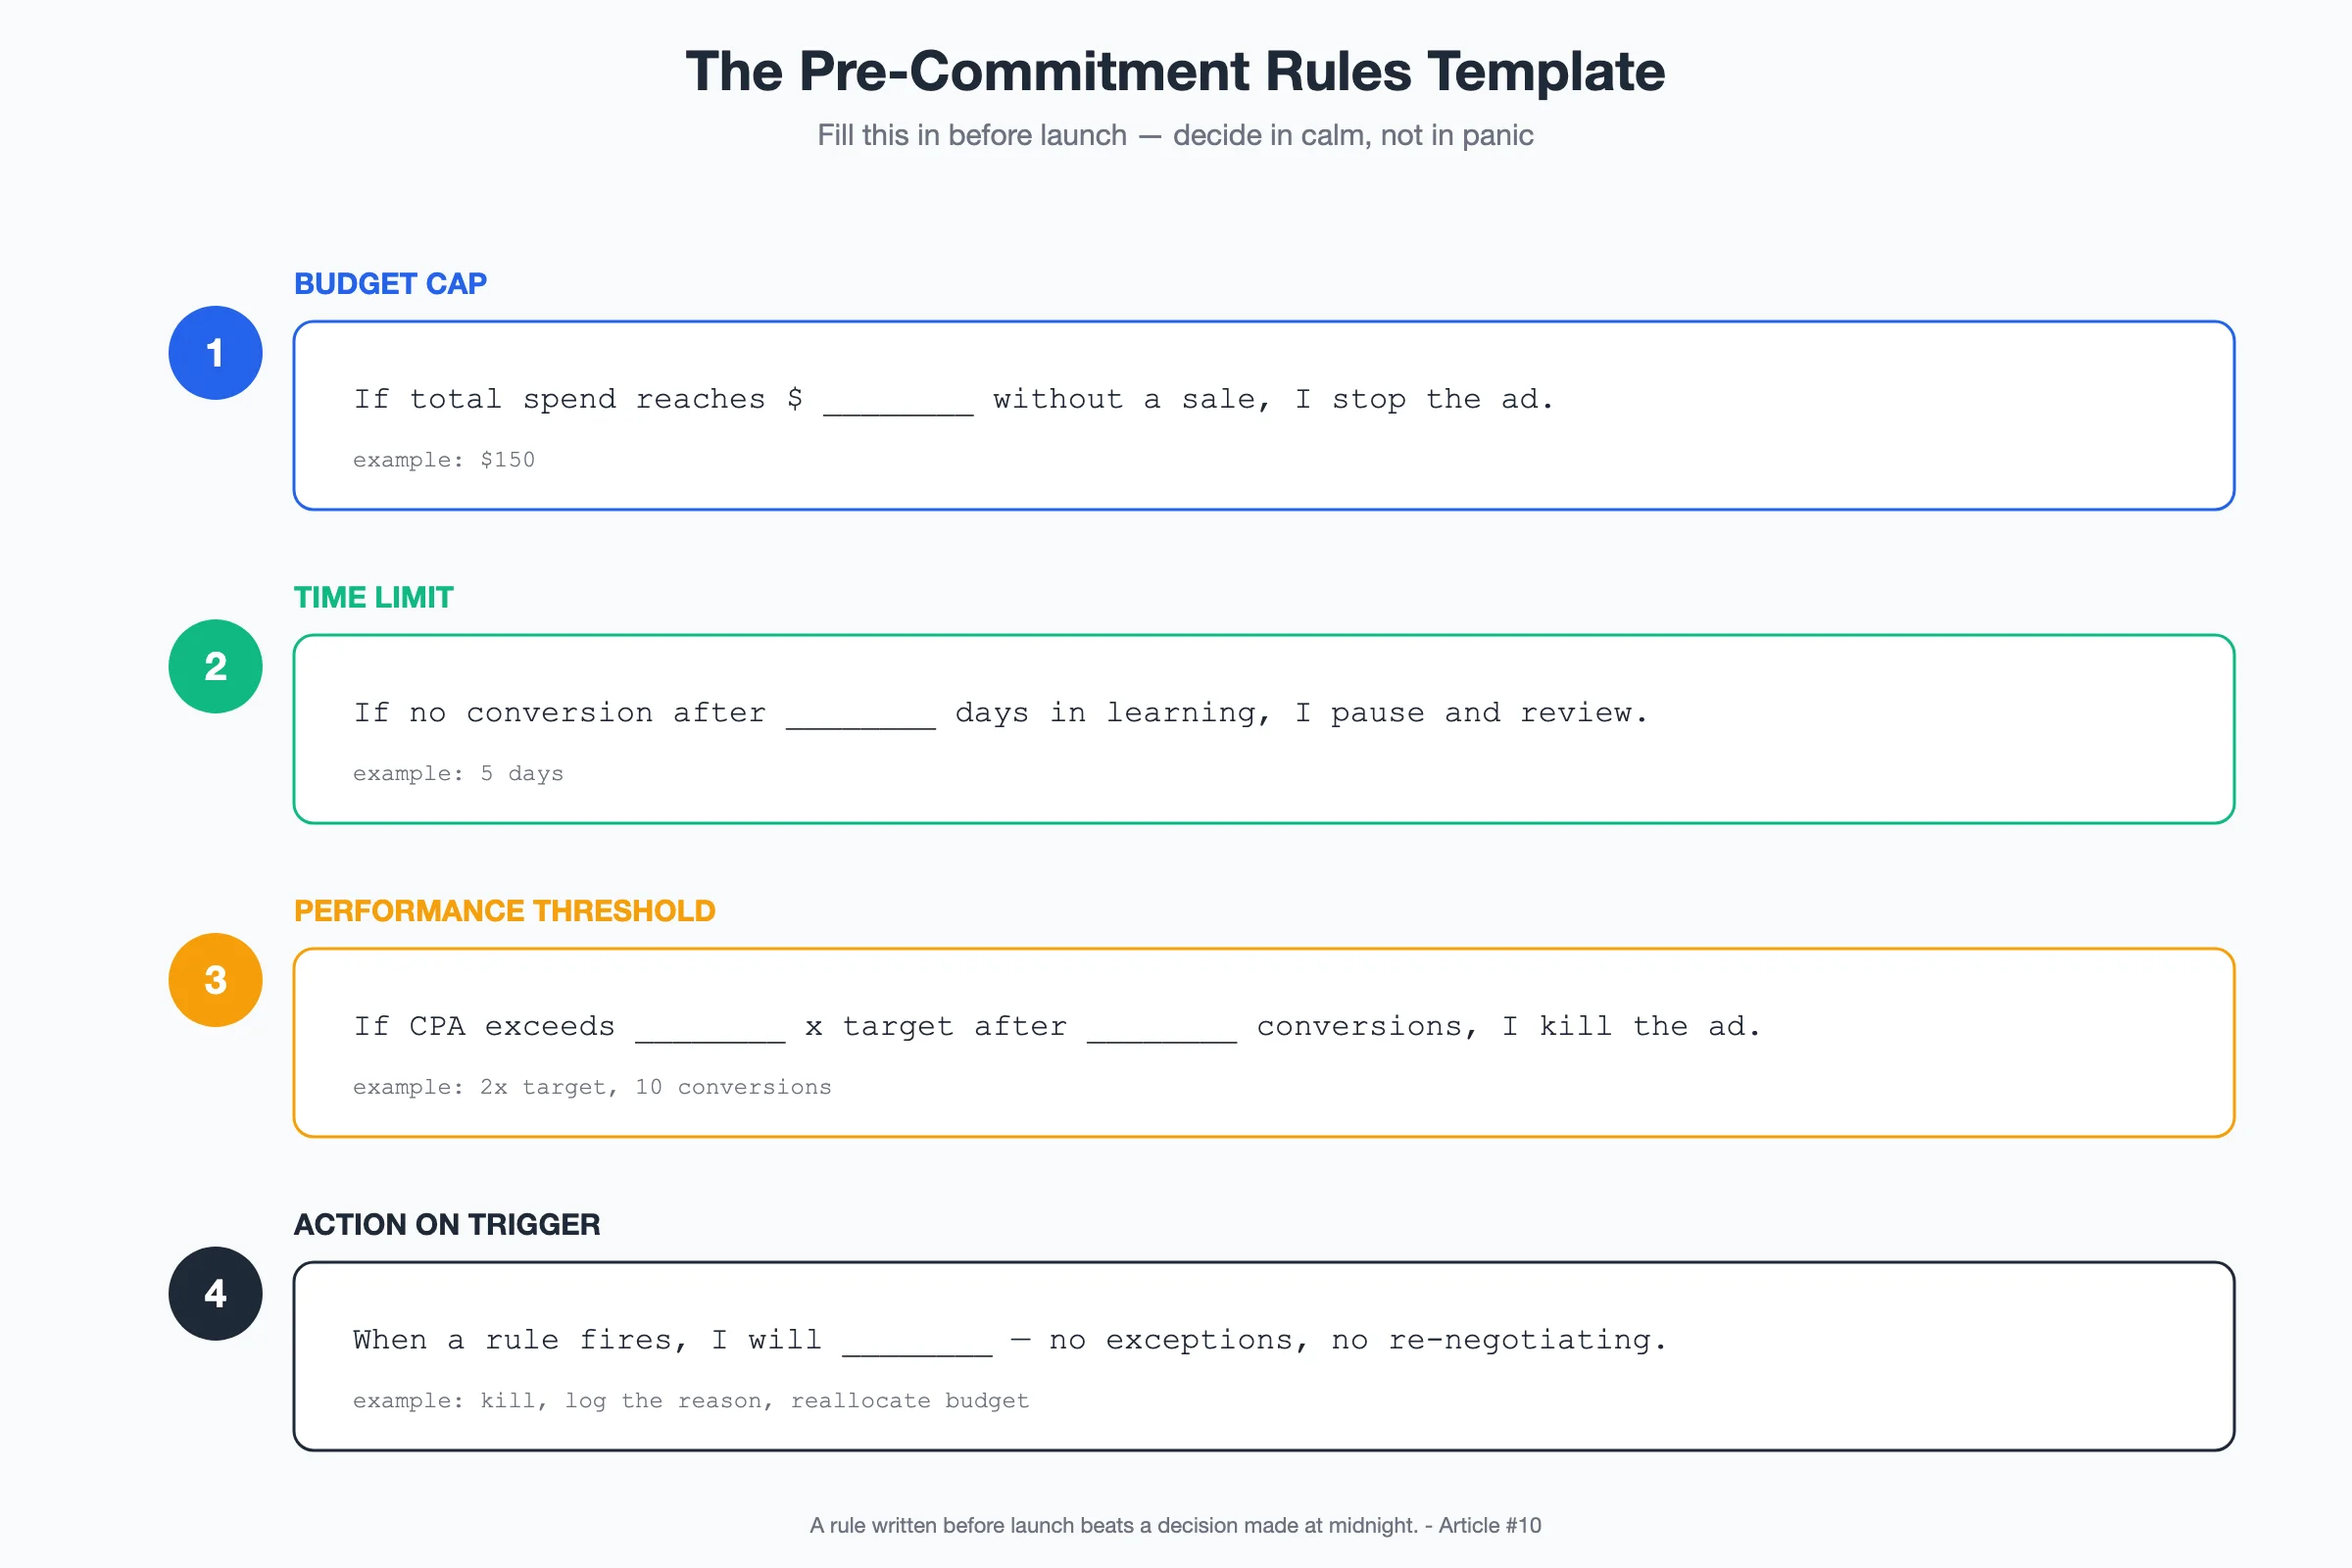
Before launching any test, document these rules in writing:
Budget allocation:
- Total test budget: $[amount]
- Per variant maximum: $[amount]
- Duration minimum: [number] days
- Duration maximum: [number] days
Continuation criteria:
- Minimum conversions for evaluation: [number, e.g., 15]
- Target ROAS threshold: [number, e.g., 2.5x]
- Acceptable CPA range: $[min] - $[max]
- Break-even ROAS: [number]
Kill criteria:
- Maximum spend without meeting target ROAS: $[amount]
- Maximum duration without stabilization: [number] days
- Minimum sample size for statistical significance: [number]
Scale criteria:
- Minimum consecutive days meeting targets: [number, e.g., 3]
- Minimum performance above threshold: [percentage, e.g., 20%]
- Budget increase increment: [percentage, e.g., 20% at a time]
Documenting these rules before testing prevents emotional decisions during stress. Revisit and adjust quarterly based on what you learn.
Sample Size and Duration Guidelines
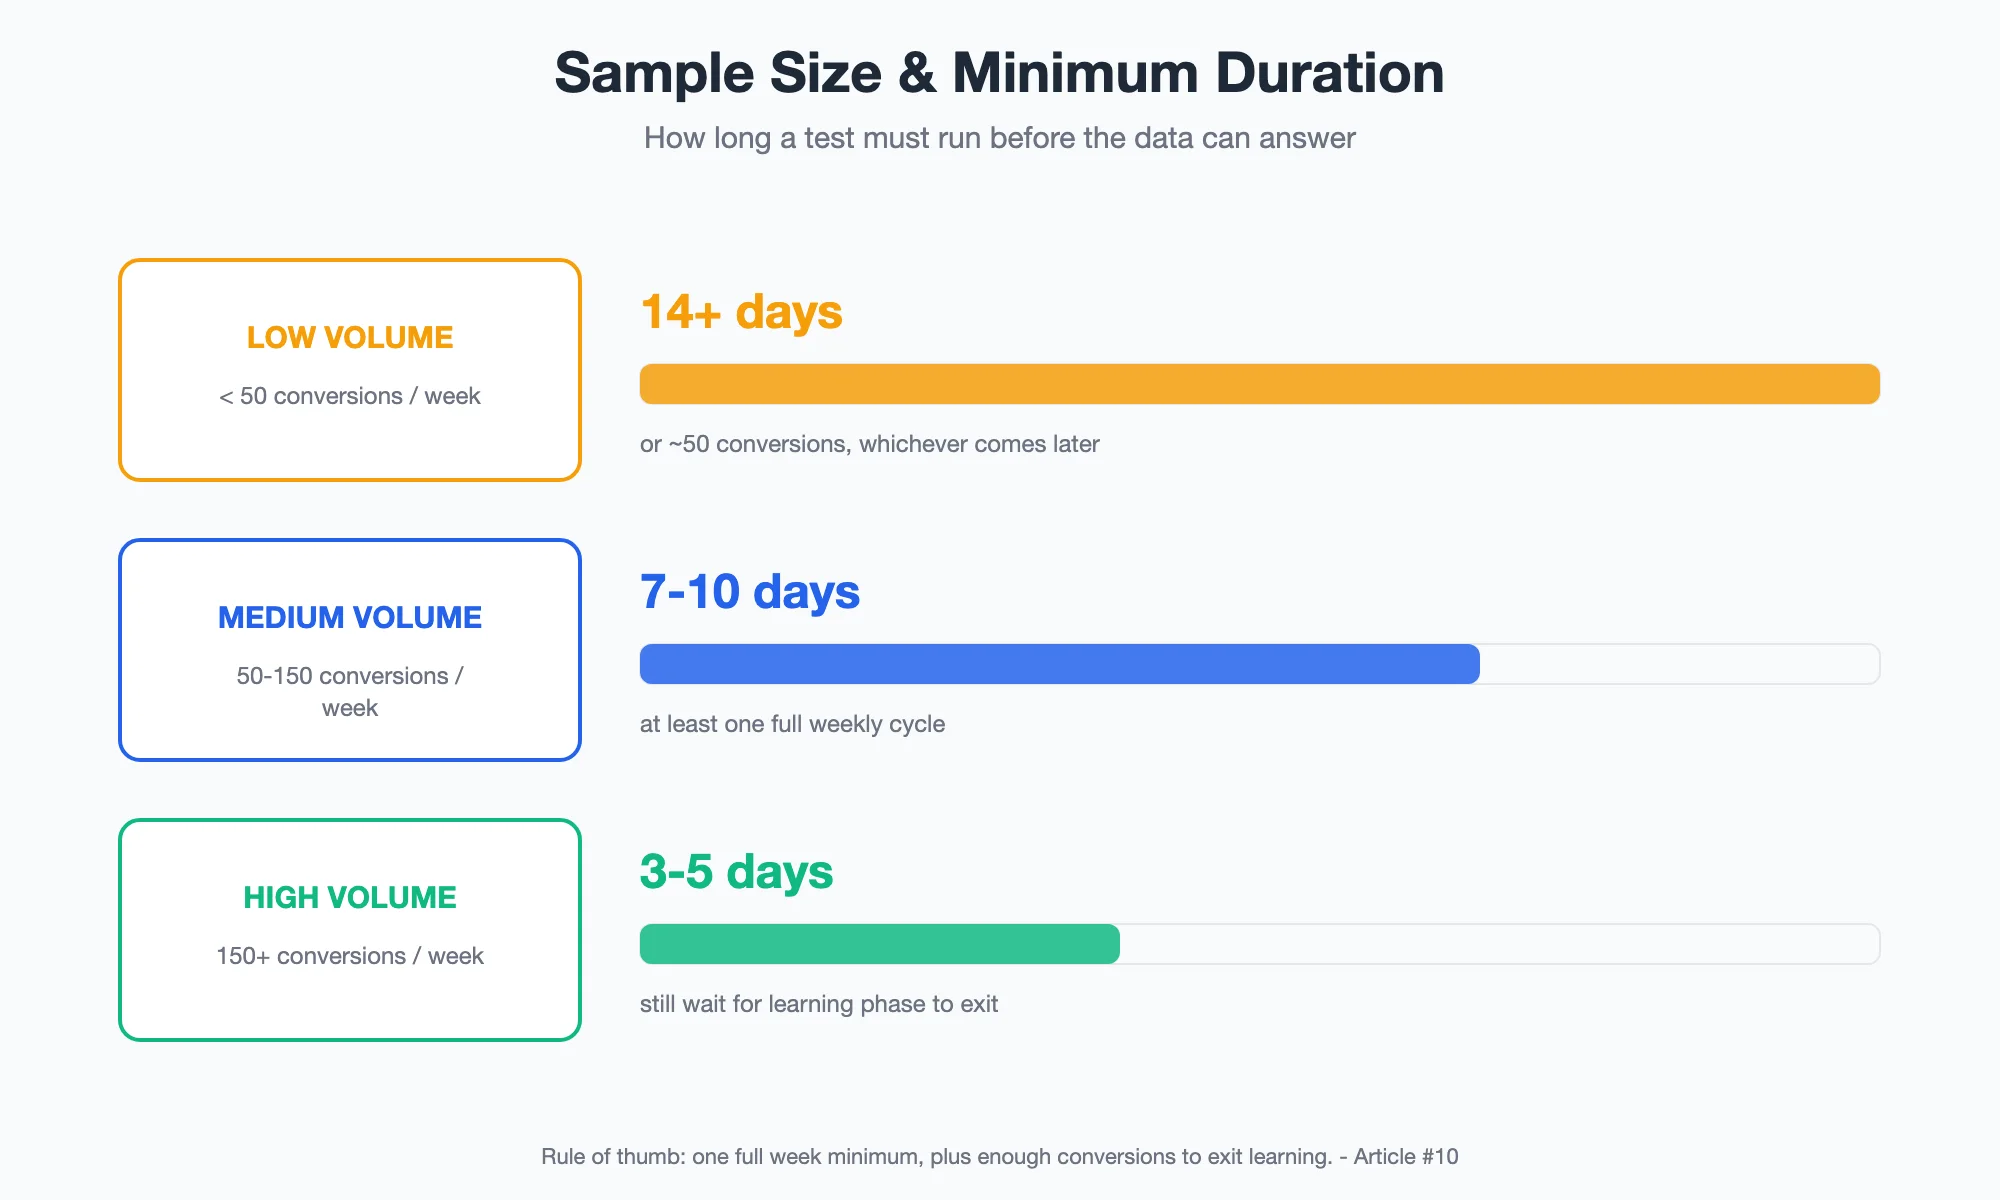
How long should you test before drawing conclusions? Depends on conversion volume:
Low volume (<10 conversions/day):
- Minimum test duration: 14 days
- Minimum spend per variant: $500
- Minimum conversions for evaluation: 30
- Why: Small samples require extended periods to accumulate statistical power
Medium volume (10-50 conversions/day):
- Minimum test duration: 7 days
- Minimum spend per variant: $200
- Minimum conversions for evaluation: 20
- Why: Moderate volume balances learning velocity with statistical reliability
High volume (>50 conversions/day):
- Minimum test duration: 3 days
- Minimum spend per variant: $100
- Minimum conversions for evaluation: 15
- Why: High volume enables rapid learning; extended testing wastes opportunity
These are minimums, not recommendations. When possible, extend tests beyond minimums to capture weekend/weekday variations and reduce noise.
Statistical vs Practical Significance
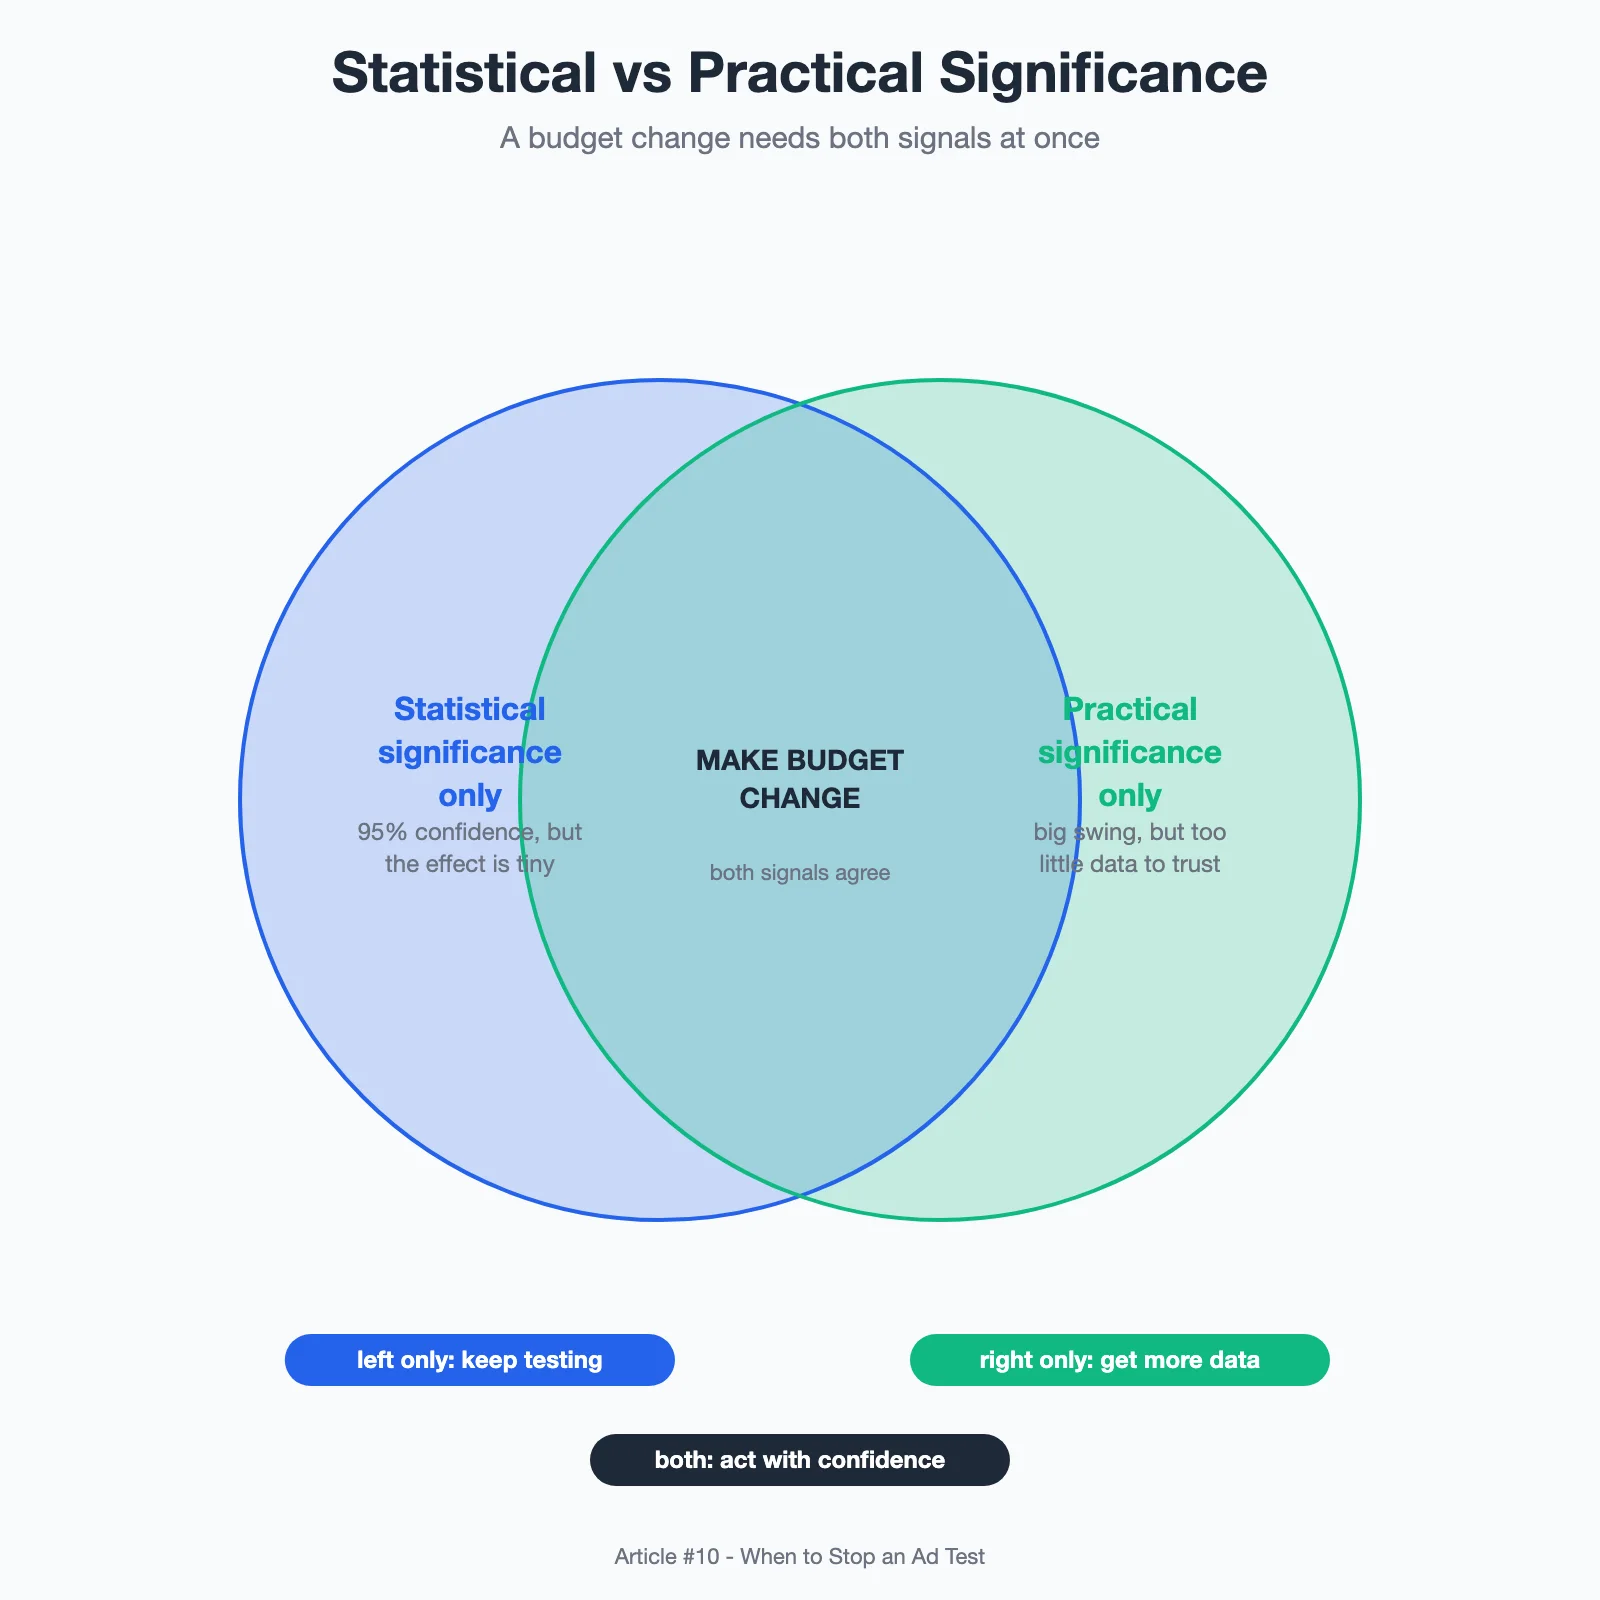
Understanding difference critical for sound decisions:
Statistical significance: Tells you whether performance difference is real or random noise. Typically measured via p-value (<0.05 indicates statistically significant).
Practical significance: Tells you whether difference matters for your business. A 0.1x ROAS improvement may be statistically significant at large sample sizes but irrelevant if it doesn't move profitability.
Example: Campaign A: 2.50x ROAS, 500 conversions Campaign B: 2.60x ROAS, 500 conversions
Statistically significant? Yes (p < 0.05). Practically significant? Maybe. That 0.1x improvement equals ~4% revenue increase. If marginal costs of scaling exceed 4%, improvement doesn't justify budget shift.
Decision rule: Require both statistical AND practical significance before making major budget changes. Don't optimize for tiny gains that don't impact bottom line.
Lag-Aware Framework: Account for Attribution Windows
Meta's 7-day click / 1-day view attribution creates lag effects that distort short-term ROAS readings:
Scenario: You launch new creative on Monday. By Wednesday, 1-day click ROAS shows 1.5x (poor). But 7-day click ROAS will likely improve as delayed conversions accumulate over following week.
Common error: Killing creative on day 3 based on incomplete attribution data.
Better approach: Wait for full attribution window before evaluating new creative. For 7-day click campaigns, minimum 7-day evaluation period mandatory.
Exception: Real-time metrics like CTR and CPC can inform early warnings, but don't use them for final continuation decisions.
When to Stop Testing Altogether
Sometimes the right decision is stopping tests entirely:
Budget constraints: If total ad spend <$3,000/month, testing consumes disproportionate resources. Focus on optimizing winners rather than continuous experimentation.
Creative capacity: If team can't produce 10+ new variations monthly, testing becomes bottleneck. Build production capacity before expanding test program.
Organic performance dominant: If organic/social media/word-of-mouth drives >50% of revenue, paid testing less critical. Allocate resources to amplify organic momentum instead.
Market maturity: In saturated categories with limited differentiation, testing边际收益递减。Focus on brand building and customer retention rather than incremental optimization.
Recognize when testing stops providing value and pivot resources accordingly.
The Real Question: Are You Optimizing for Learning or Results?
Here's where merchants make strategic errors: They optimize for immediate results when they should be optimizing for learning velocity.
A campaign performing at 2.0x ROAS might be worth continuing at loss-leader level if it's generating critical learning about audience preferences. A campaign performing at 4.0x ROAS might deserve budget cuts if it's not teaching you anything new.
Your answer depends on:
- What stage is your business in (learning vs scaling)?
- How much do you know versus need to know about your audience?
- Is your primary constraint budget or information?
- Can you afford to hold suboptimal performers for learning value?
There's no universal answer. But there is a calculable one for your specific situation. Document your testing philosophy, align it with business objectives, and let strategy—not panic—guide your decisions.
Sources:
- Darkroom Agency Creative Fatigue Framework – Performance testing methodology
- Unity ROAS Benchmarks – ROI measurement fundamentals
- Stackmatix Meta Ads Guide – Platform-specific testing insights
- Sohu ROAS Decline Analysis – Troubleshooting frameworks