How I Catch Creative Fatigue Before My ROAS Collapses
I do not wait for ROAS to collapse. Here is the creative-fatigue dashboard, thresholds, and rotation cadence I watch every single week.
Practitioner playbook — a composite field guide written from the perspective of a Paid Social Buyer. Figures are illustrative, not verified client results.
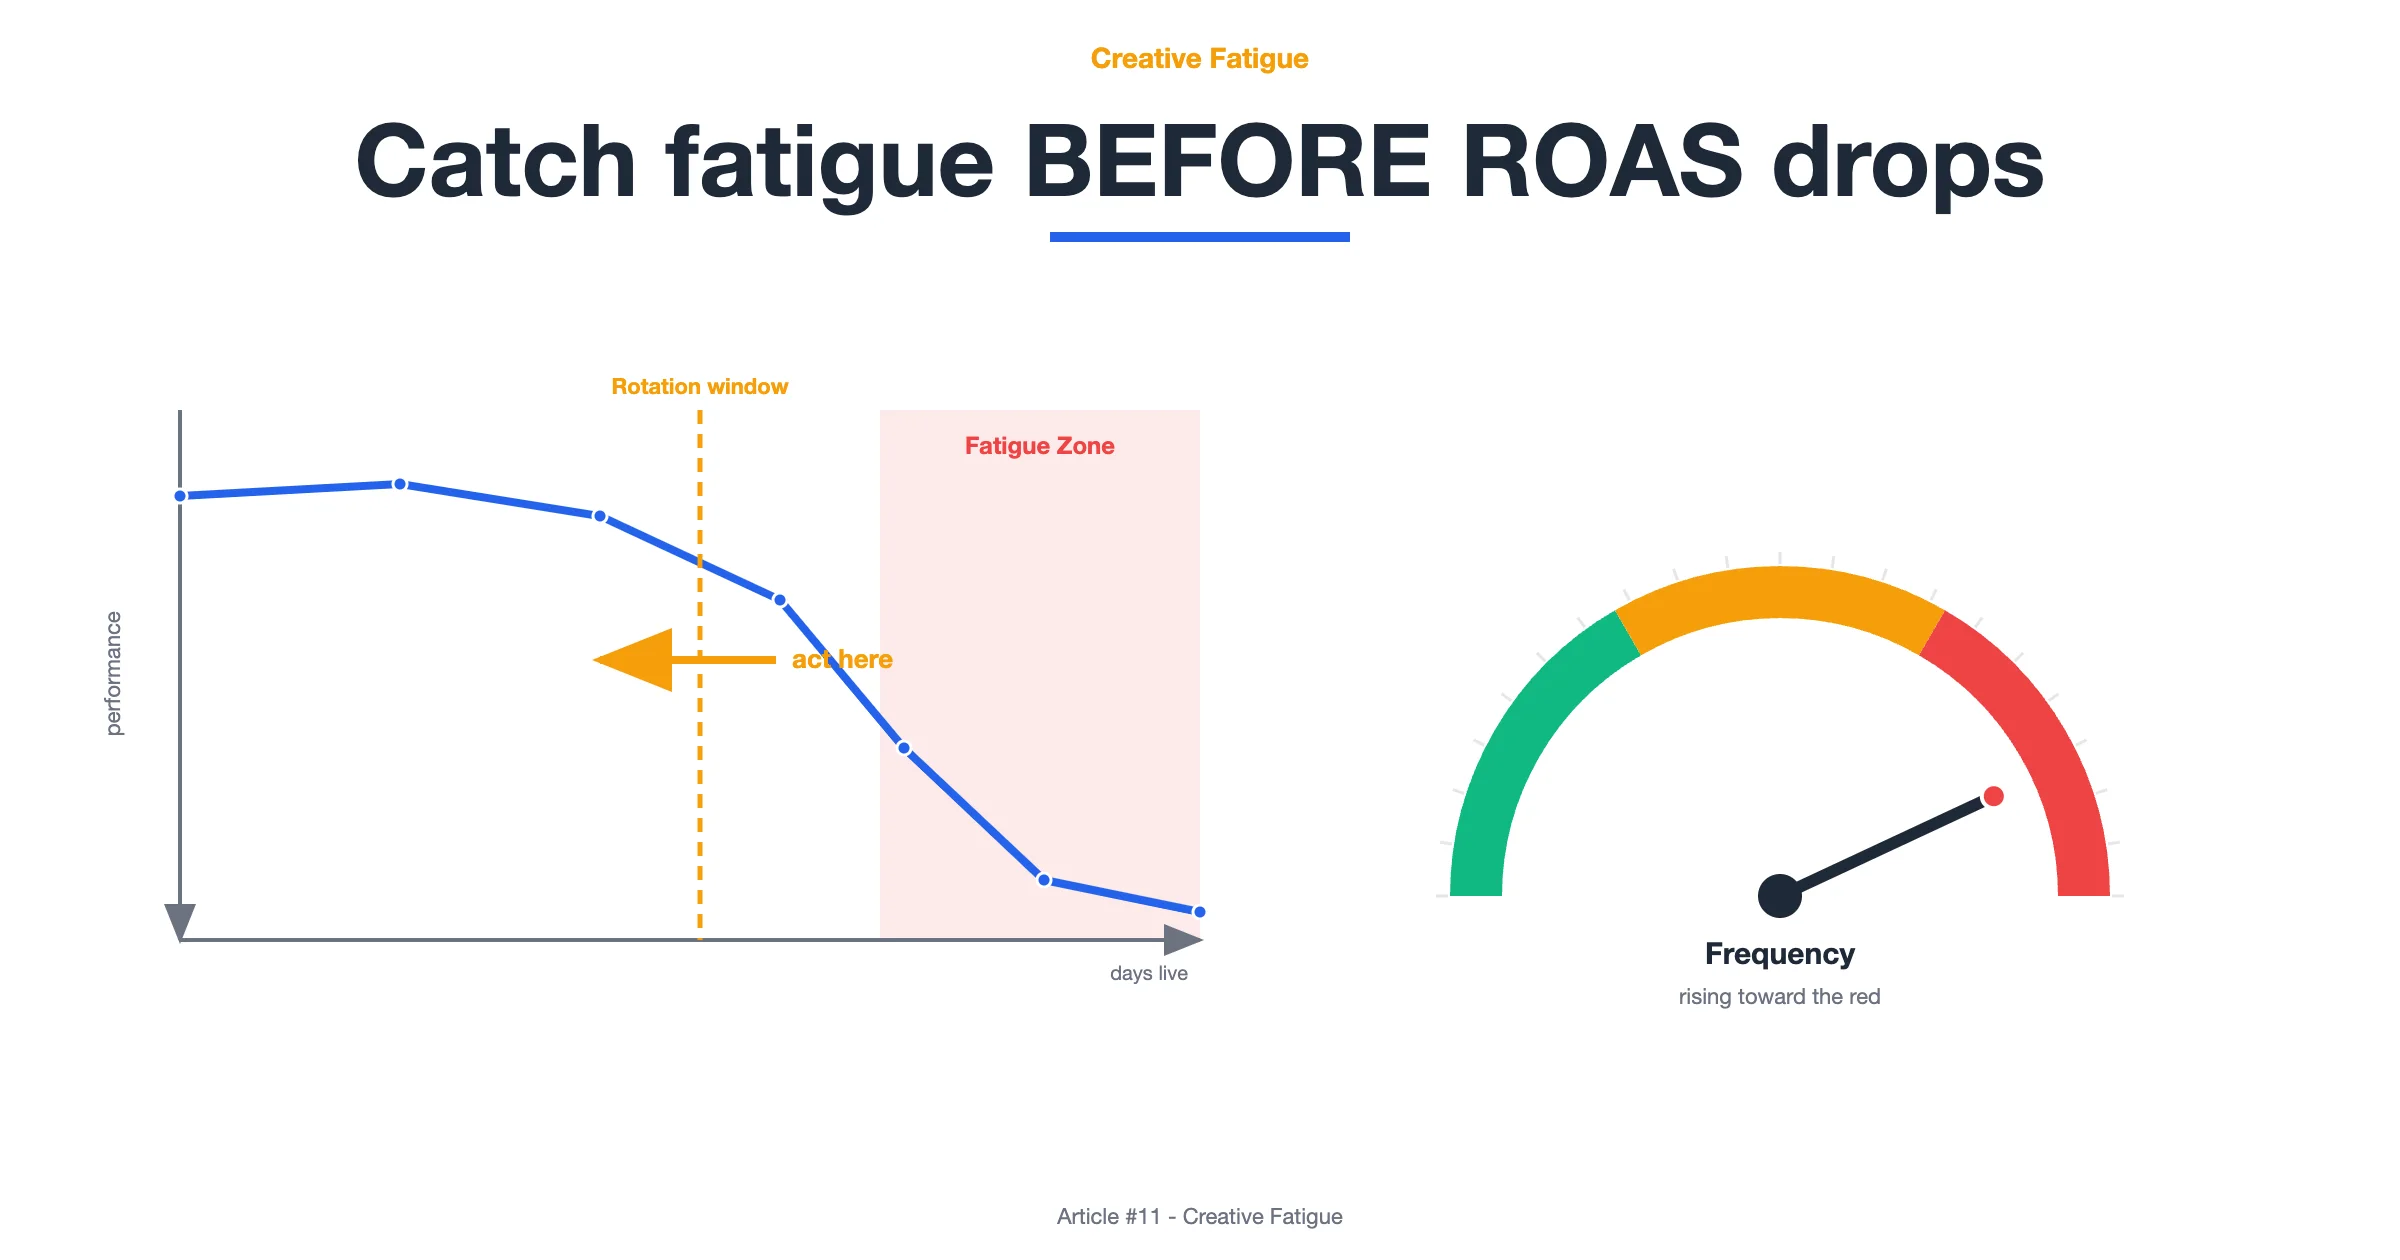
The first ad account I ever managed taught me creative fatigue the hard way. A winning angle ran beautifully for three weeks, then ROAS slid from a healthy range down toward breakeven over eight days, and I kept blaming the audience, the seasonality, the "algorithm." None of it was the algorithm. The creative was simply exhausted, and I had been watching the wrong number at the wrong cadence.
Now I treat fatigue as a leading indicator, not a post-mortem. My job is to see the decay while the ad is still spending well, while there is still enough runway to swap a variant without a delivery cliff. The difference between a graceful rotation and a panic rebuild is about ten days of lead time, and that lead time only exists if I have a dashboard, a set of thresholds, and a decision tree I trust before the numbers turn ugly.
What follows is the exact playbook I run on every paid social account: the signals I track, the thresholds that separate "healthy" from "tired," the rotation cadence that keeps frequency honest, and the refresh decision tree that tells me whether to change the hook, the pacing, or the entire angle.
The Signals I Watch Before the Numbers Turn
I do not read ROAS first. ROAS is a lagging rollup; by the time it moves, the damage is done. I watch a small dashboard of leading signals and let them warn me. The four I check every morning are hook rate (how many people survive the first three seconds), thumb-stop or 3-second-to-impression ratio, click-through rate trend, and the frequency number rising on my core audiences. Fatigue almost always shows up in two or more of these before it touches purchase ROAS.
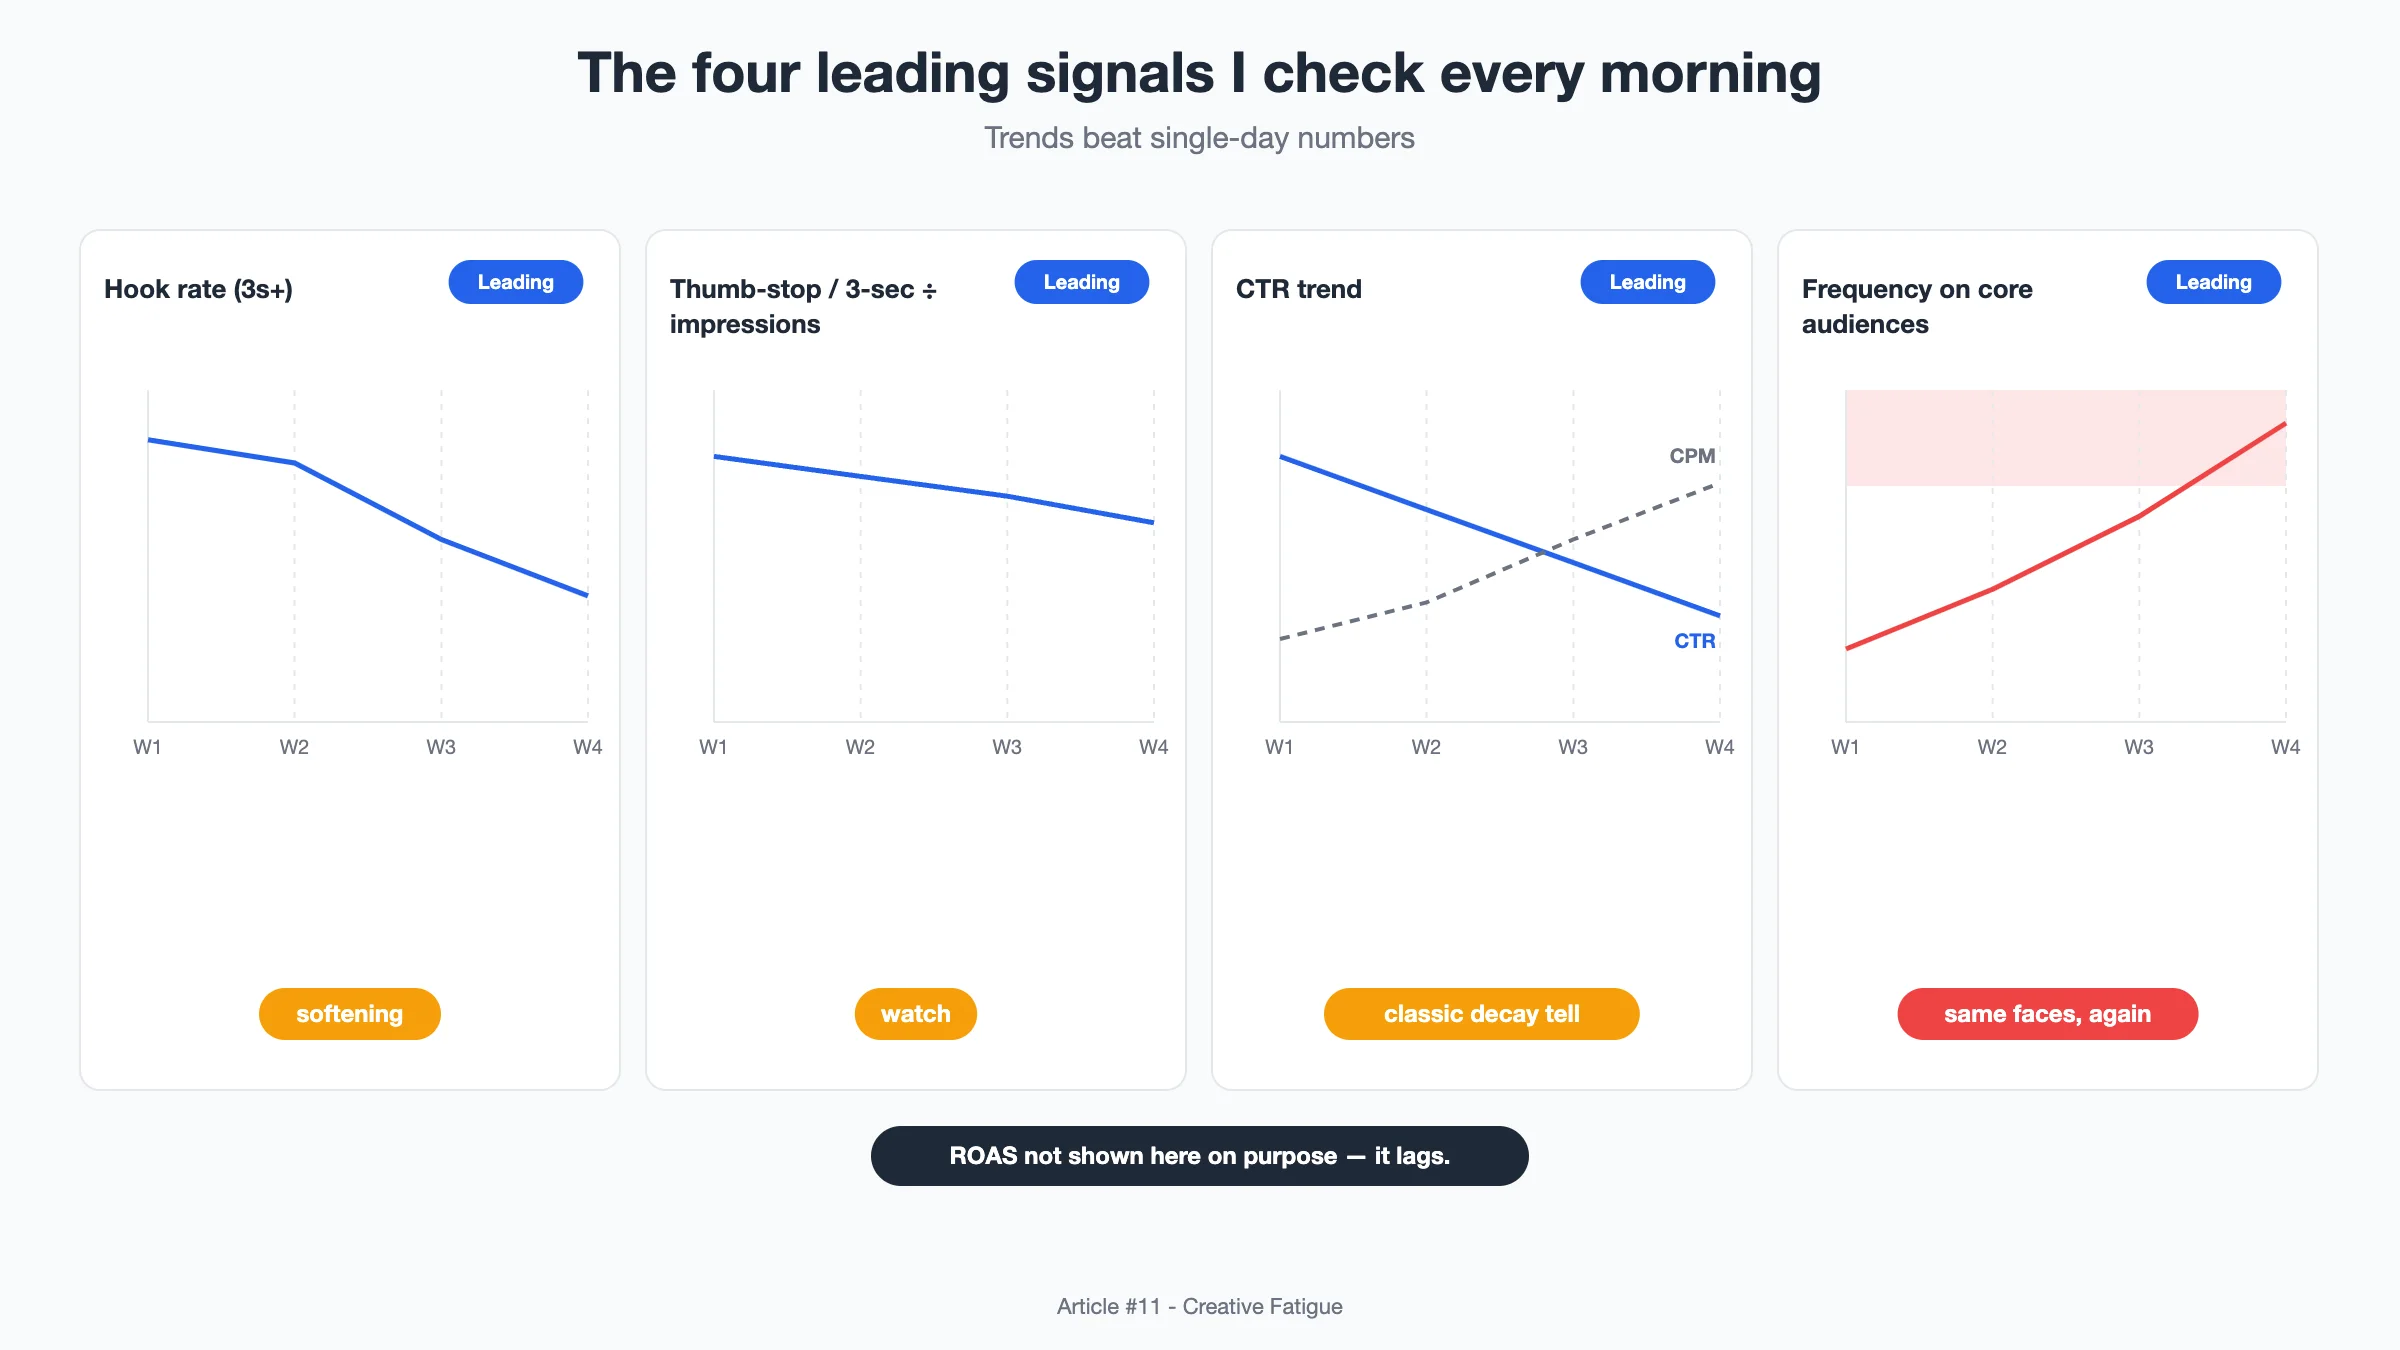
The single most reliable early tell for me is a CTR trend that decays week over week while CPM stays flat or climbs. That combination says the same faces are seeing the same ad and stopping noticing it. Hook rate softening is the second tell: if fewer people make it past the first three seconds on the same creative, the opening has gone stale for this audience even if the offer has not changed.
My Healthy-vs-Fatigued Threshold Table
Signals mean nothing without reference points, and reference points have to be relative to the account's own history, not some global benchmark. I keep a threshold table pinned above my desk. Every band is a range I derived from watching an account's own baseline drift, so I reset it whenever the account changes scale or offer. The table below is the shape of it, expressed as the directional ranges I trust, not absolutes.
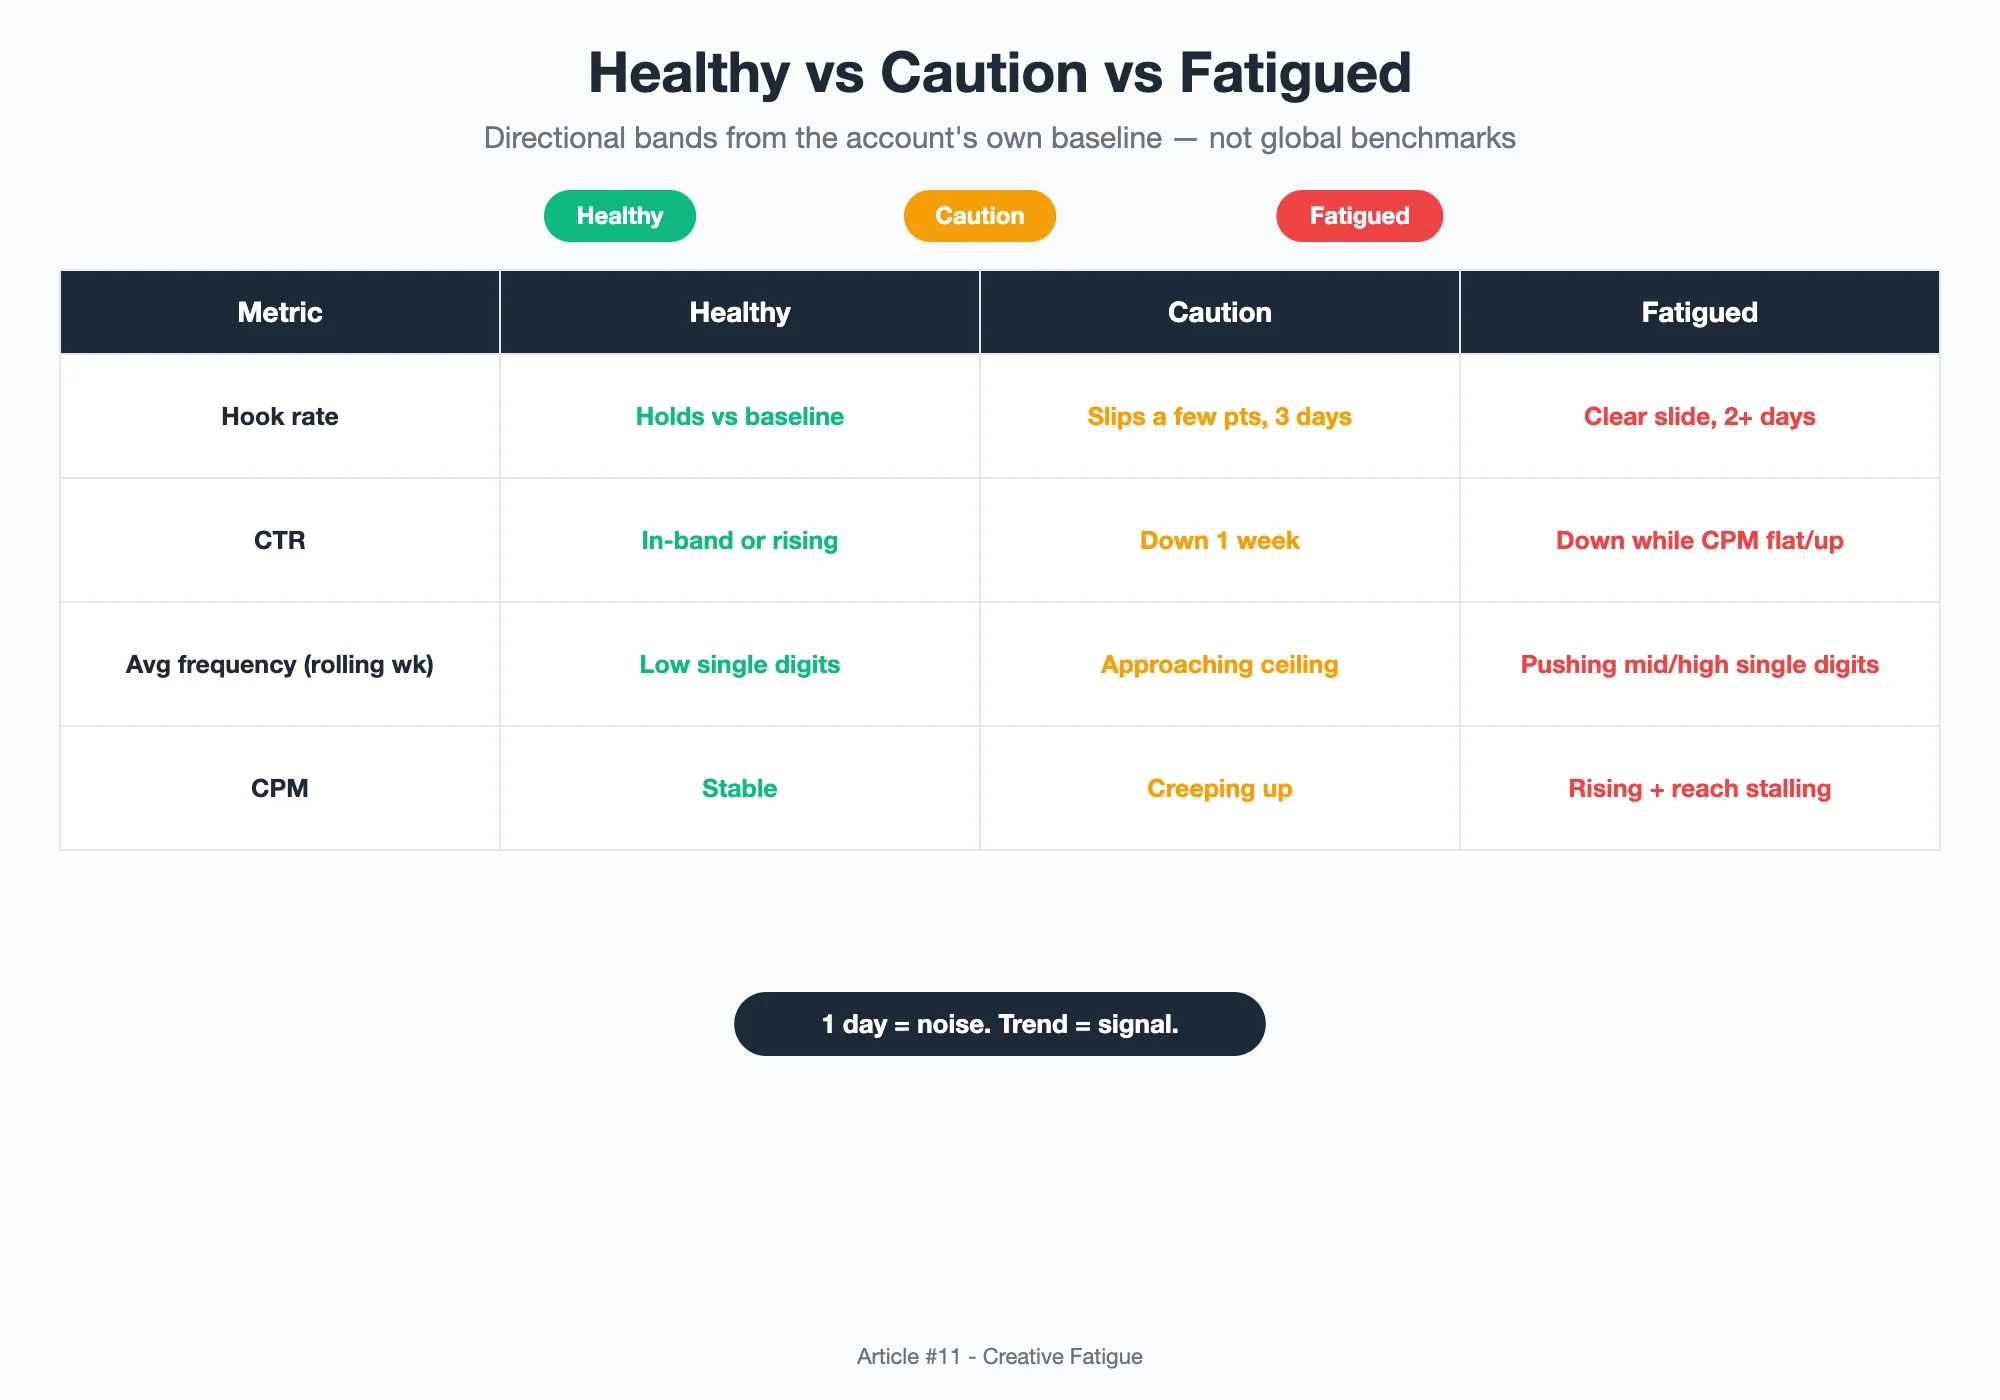
My general rule of thumb: when a metric crosses from the healthy band into the caution band for three consecutive days, I flag the creative as "watch." When it crosses into the fatigue band for two consecutive days, or two metrics sit in caution at once, the creative is "tired" and I move it into the refresh queue. I never make a single-day call. A one-day dip is usually noise, a delivery hiccup, or a Monday. Fatigue is a trend, and I only act on trends.
The Rotation Cadence That Keeps Frequency Honest
Fatigue is mostly a frequency problem wearing a creative costume. The moment one core audience is seeing the same asset five, six, seven-plus times, decay is not a risk, it is a schedule. So I do not wait for decay; I rotate on a calendar and treat the calendar as the default and the data as the exception.
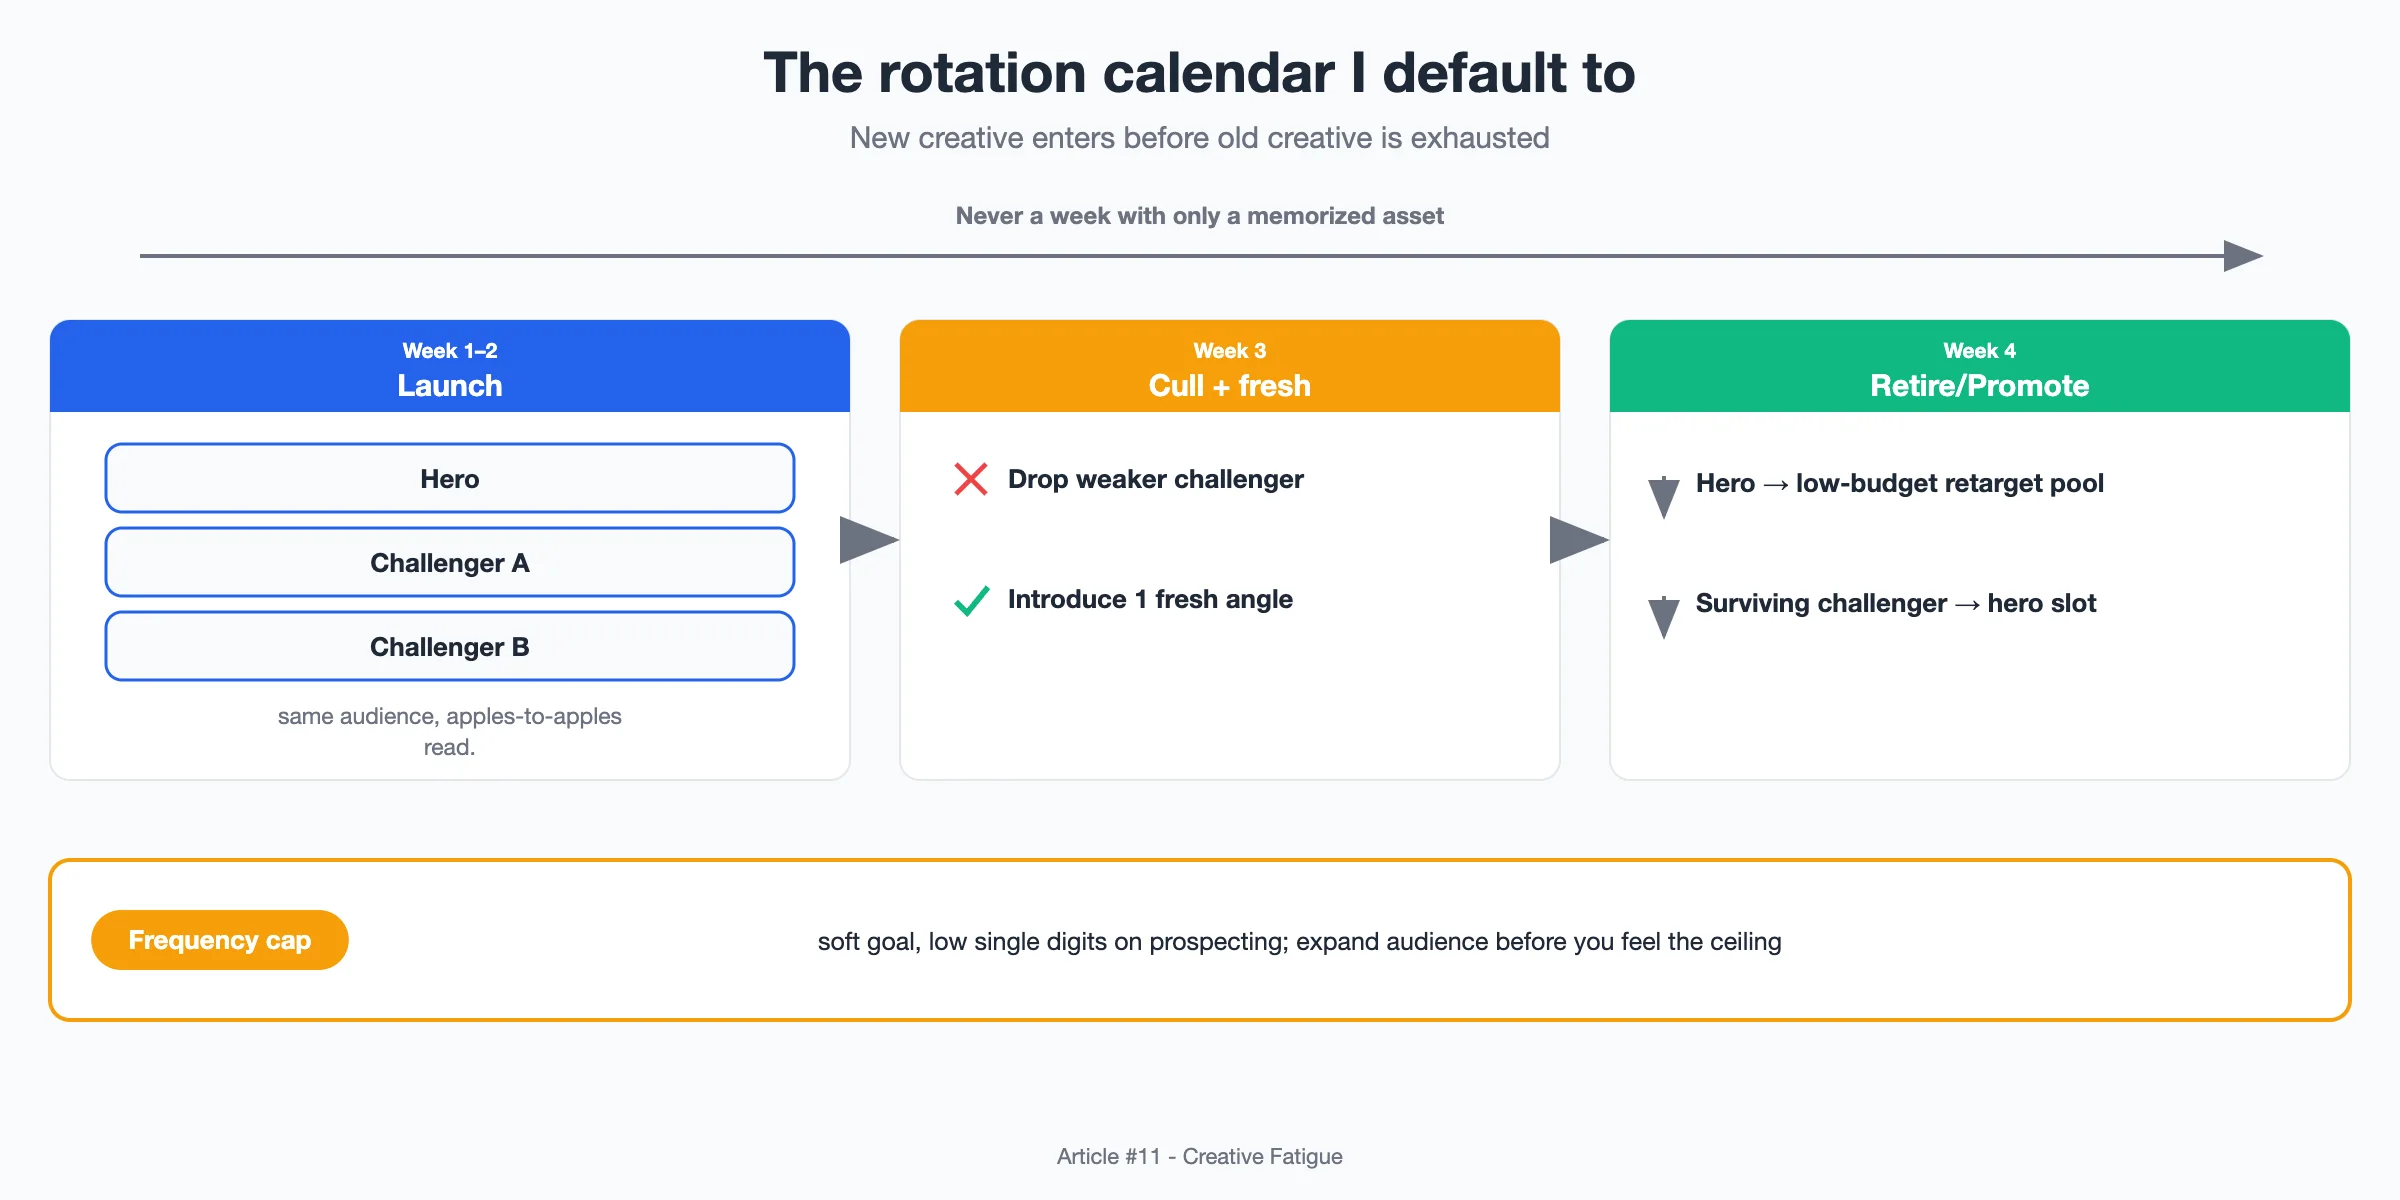
Here is the cadence I run on a steady account. Weeks one and two, the hero creative plus two challenger variants go live against the same audience so I get an apples-to-apples read. In week three, I cull the weaker challenger and introduce one fresh angle. By week four, I retire the original hero to a low-budget retargeting pool and promote the surviving challenger into its slot. The point is that a new creative always enters the auction before the old one is exhausted, so I never have a week where my only proven asset is the one the audience has already memorized.
I also cap frequency before I need to. On cold, prospecting audiences I set a soft frequency goal in the low single digits per rolling week and expand the audience when I feel it pressing that ceiling, rather than letting the platform happily hammer the same pool.
Refresh or Replace? My Decision Tree
Not every tired ad needs to be thrown away. Overreacting and killing a fundamentally strong angle wastes the learning the delivery system already paid for. So when something hits the refresh queue, I run it through a decision tree instead of my emotions.
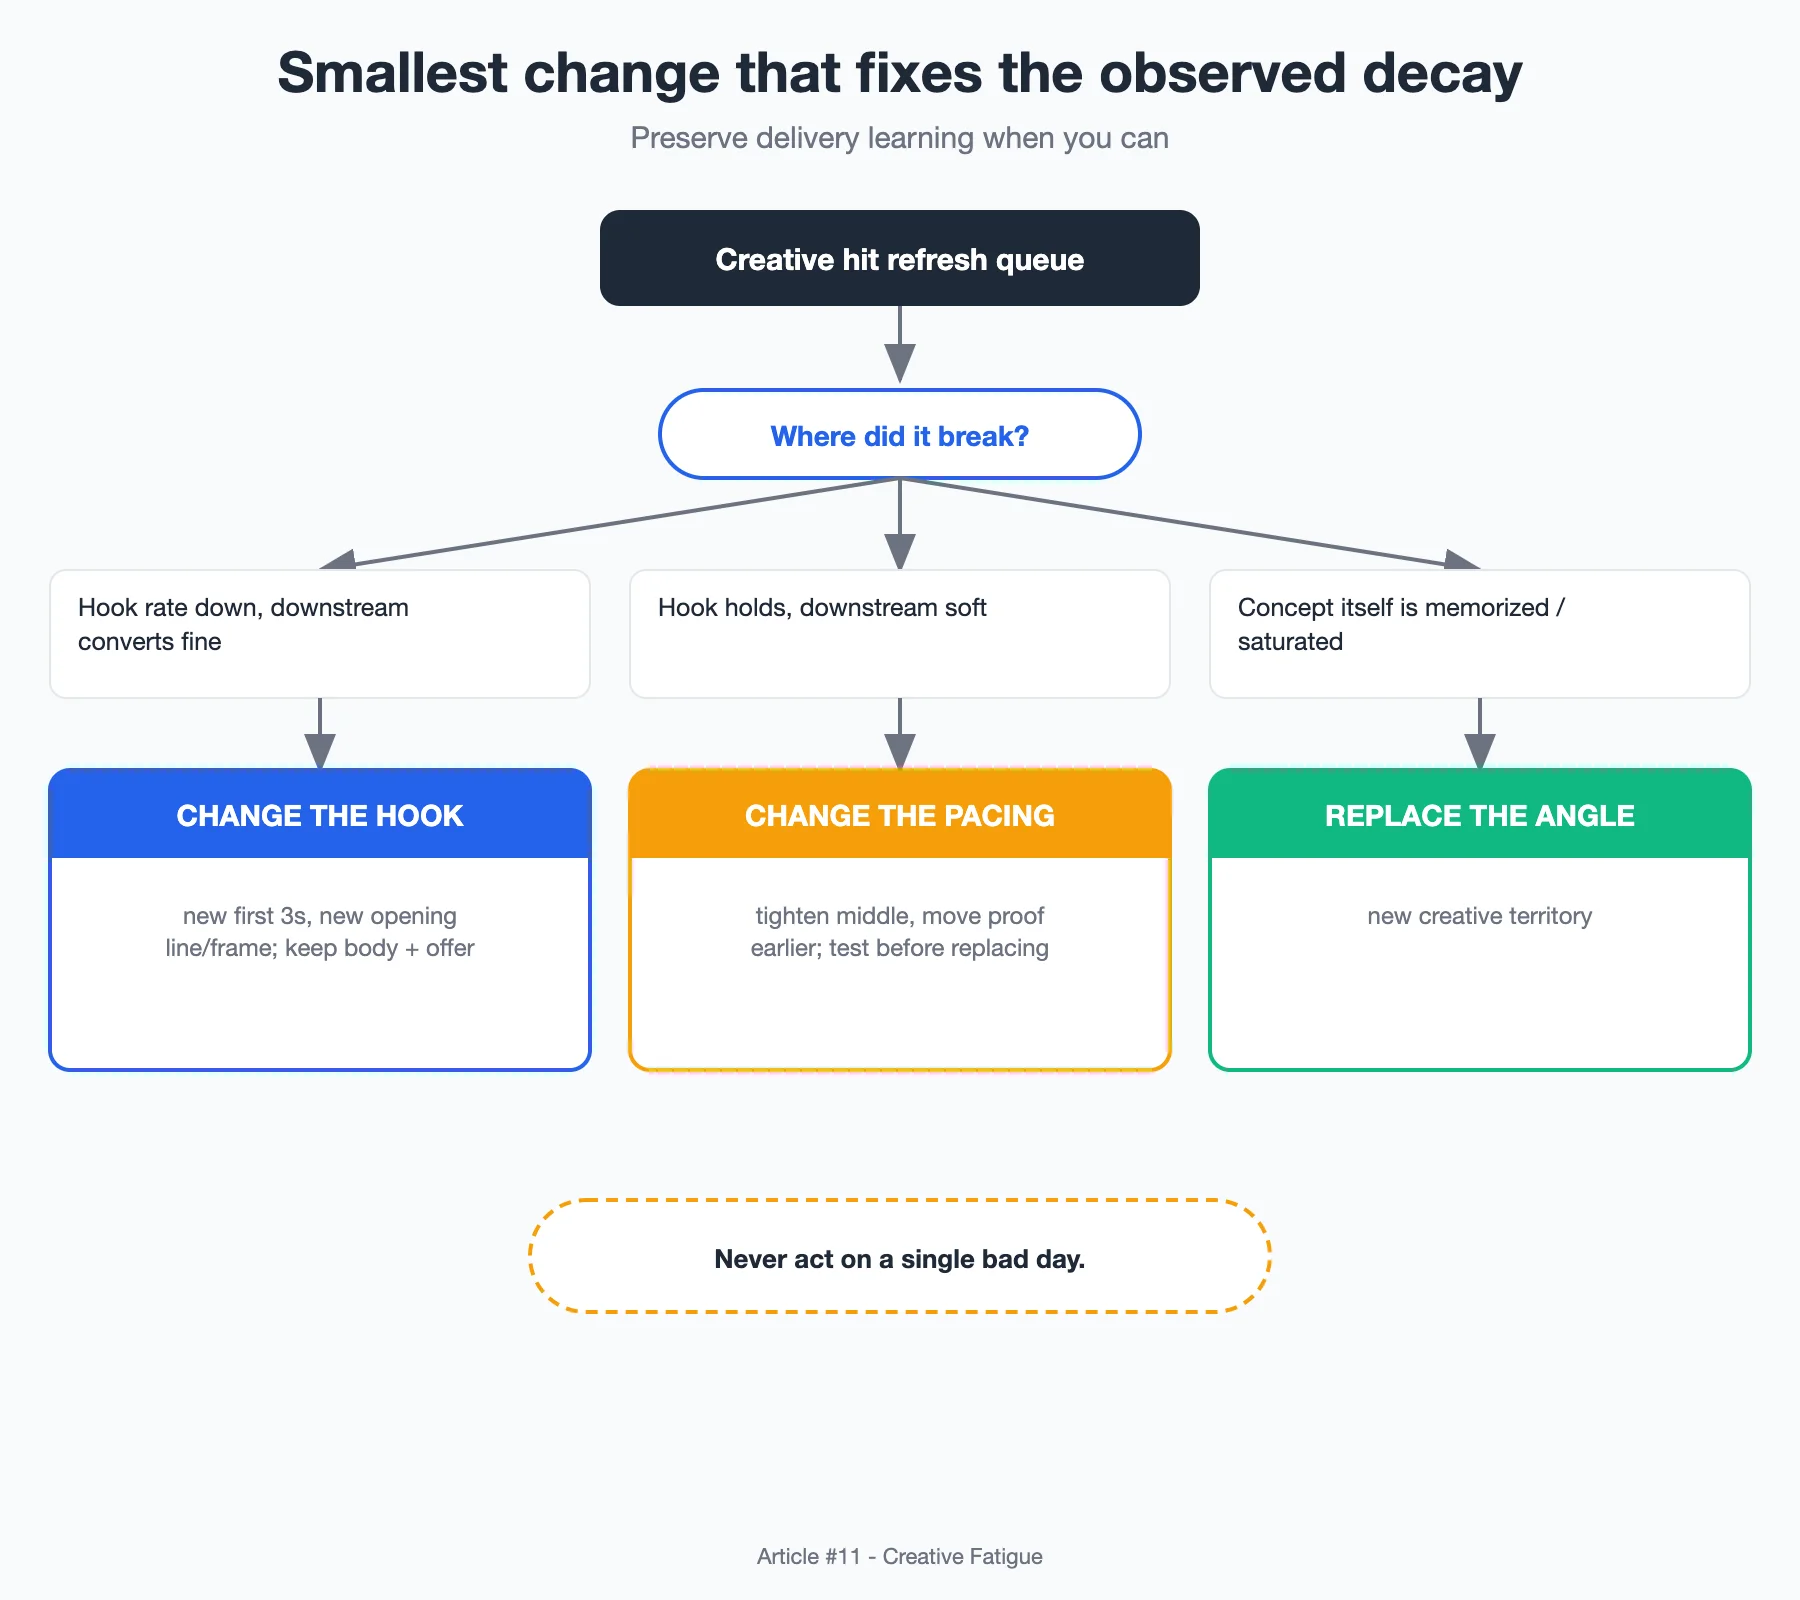
The first fork: is the top of the funnel the problem or the whole ad? If hook rate has dropped but people who make it past three seconds still convert at a normal rate, the body is fine and the opening is stale. That calls for a hook change: a new first-three-seconds, a new on-screen line, a fresh opening frame, keeping the proven middle and offer intact.
If hook rate is holding but everything downstream is soft, the pacing is the issue or the offer has stopped landing. I test a pacing edit next, tightening the middle and moving the proof earlier. Only when the angle itself has been saturated, meaning the concept is the thing the audience has memorized, do I replace the angle entirely with a new creative territory. The decision tree keeps me making the smallest change that plausibly fixes the observed decay, which preserves delivery learning and protects spend.
Why Frequency Drives the Whole Decay Curve
Everything above only makes sense if you internalize one relationship: performance is a function of exposure, and exposure is a function of a shrinking reachable pool. I draw the frequency-decay curve on the whiteboard every quarter so the team remembers why the cadence matters.
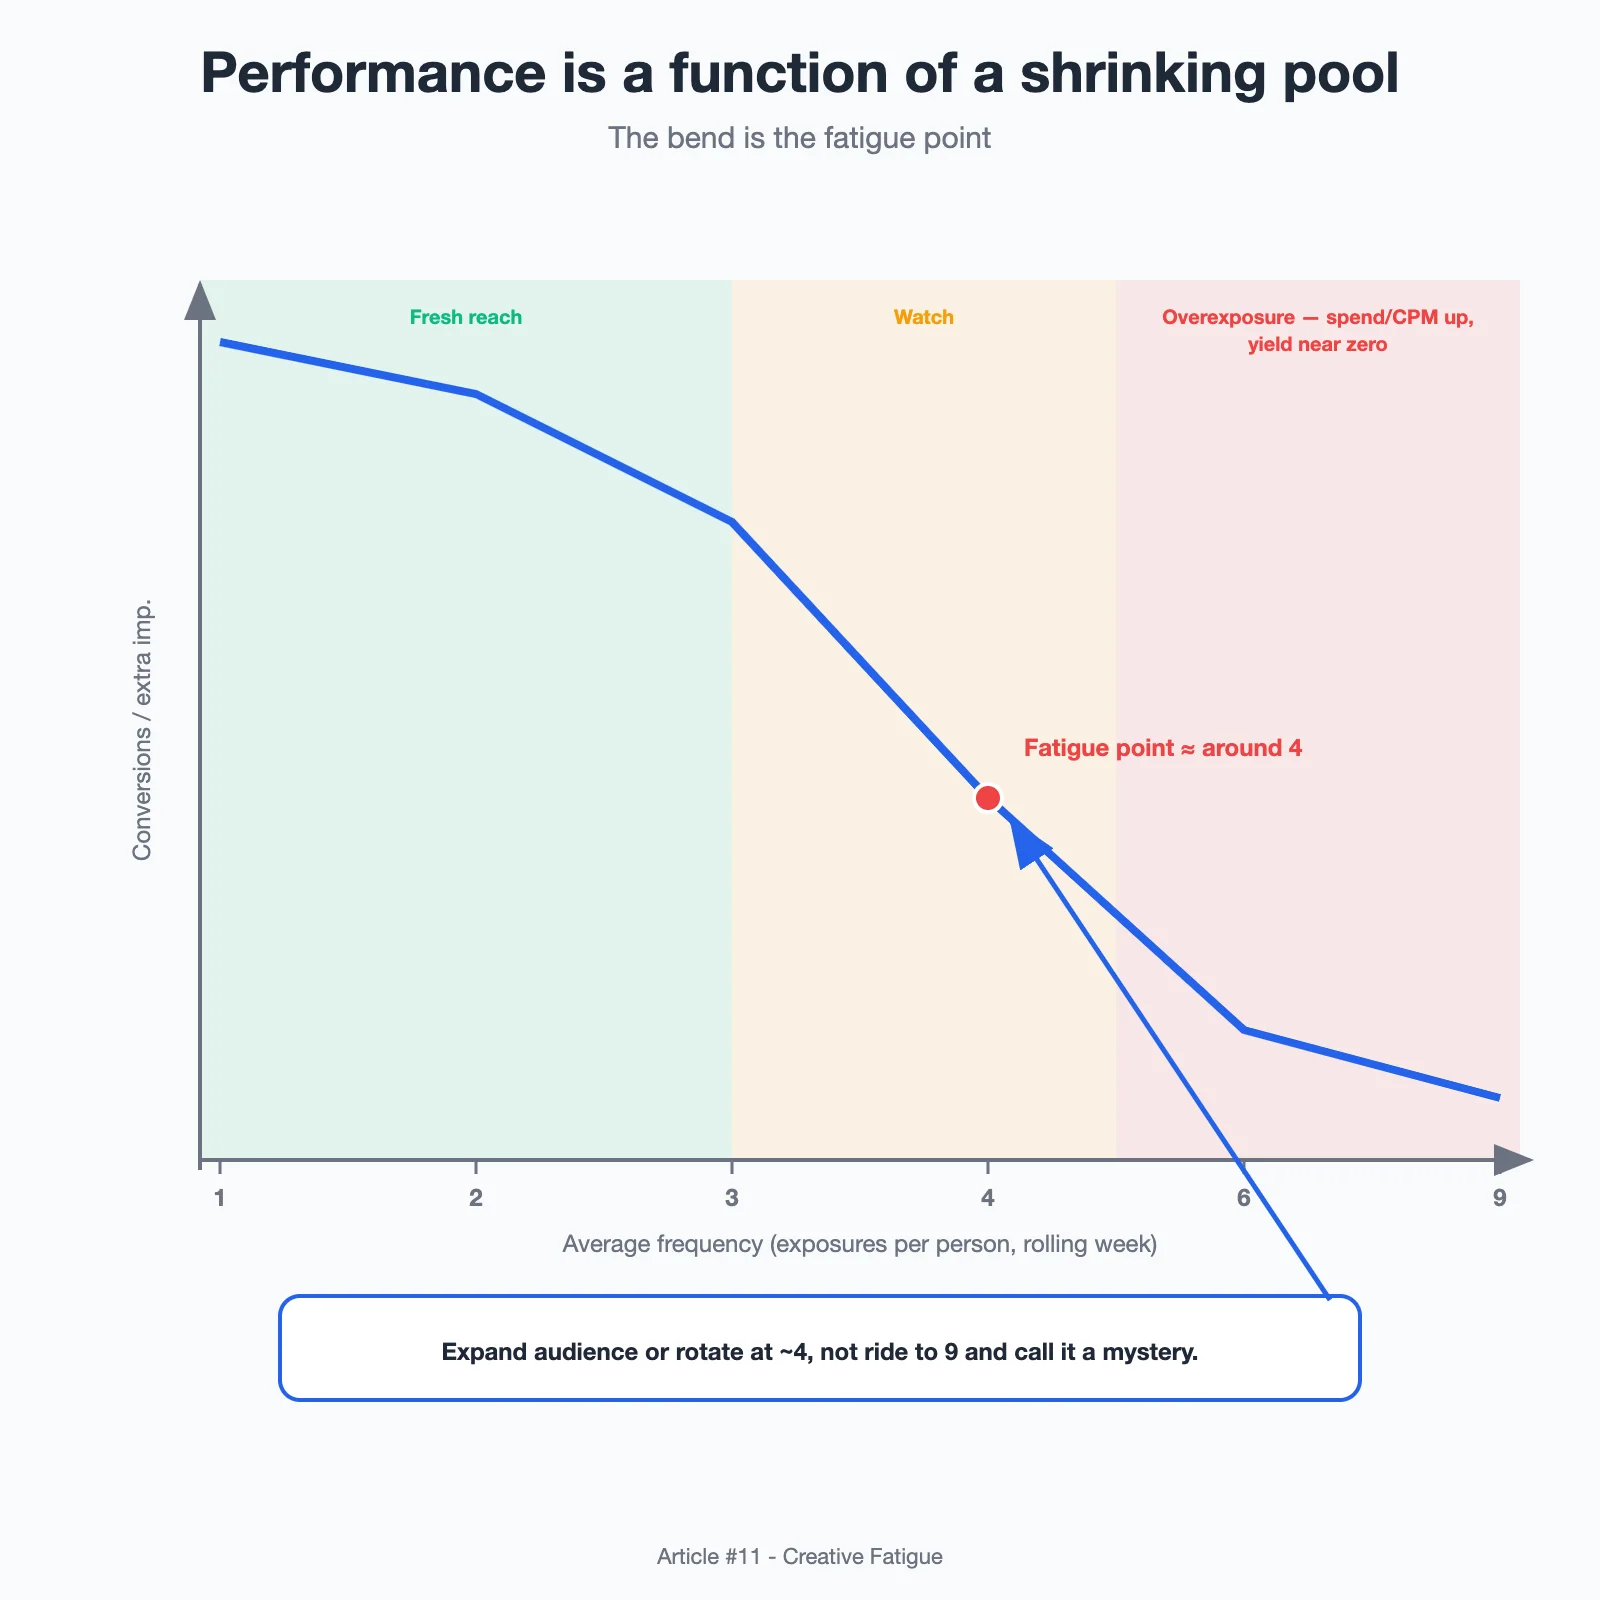
The shape is consistent across accounts I buy for. In the first one to two exposures, incremental conversions per additional impression are strong. Somewhere in the mid single digits of average frequency, the curve bends and each extra exposure yields less. Push past that and the tail flattens toward zero while CPM and spend keep climbing. That bend is the fatigue point, and it is why I would rather expand the audience or rotate the creative at a frequency around four than ride a tired asset to a frequency of nine and call the resulting ROAS dip a mystery.
The practical read of the curve: reach and new-body supply are the real fuel. When I run out of fresh reach faster than I run out of budget, creative fatigue is guaranteed on schedule, so my job is to protect the supply, not just the creative.
The Real Question: Are You Buying Reach or Just Renting Attention?
Here is the reframe that changed how I work. I used to ask, "How do I make this ad last longer?" The better question is, "How quickly am I spending through the audience that actually wants to see this ad?" Creative does not really fatigue; an audience fatigues, and the creative just records the moment they stopped caring. Every decay curve is a census of how much fresh attention I still own.
So the goal was never to build one immortal ad. It was to build a rotation engine where new creative meets an audience before the old creative bores them. When I optimize for the audience's patience instead of the asset's lifespan, fatigue stops being a collapse I survive and becomes a rhythm I stay ahead of.
Sources:
- Meta Ads Manager delivery and frequency reporting — where I pull raw frequency, reach, and the impression curves I read against my own baseline.
- TikTok Ads Manager creative analytics — hook rate, watch-through, and thumb-stop metrics I sanity-check against the account's history.
- Google Analytics 4 engagement and conversion reporting — how I connect post-click behavior to a suspected creative decay rather than a landing-page issue.
- Public benchmark roundups from tools like Metricool and Hootsuite — directional CTR and frequency ranges across verticals, used only as context, never as a target.
Disclosure: This piece is written from a practitioner's perspective to share a working method. It is not a customer testimonial, and any numbers are illustrative examples, not guaranteed outcomes.