A Dashboard Conversion Count Is Not Proof Your Ads Caused It
Platform dashboards report conversions credited inside their own window, not the sales your ads caused. Here is how to read that number, why cross-channel totals double-count, and when to run a geo lift test.
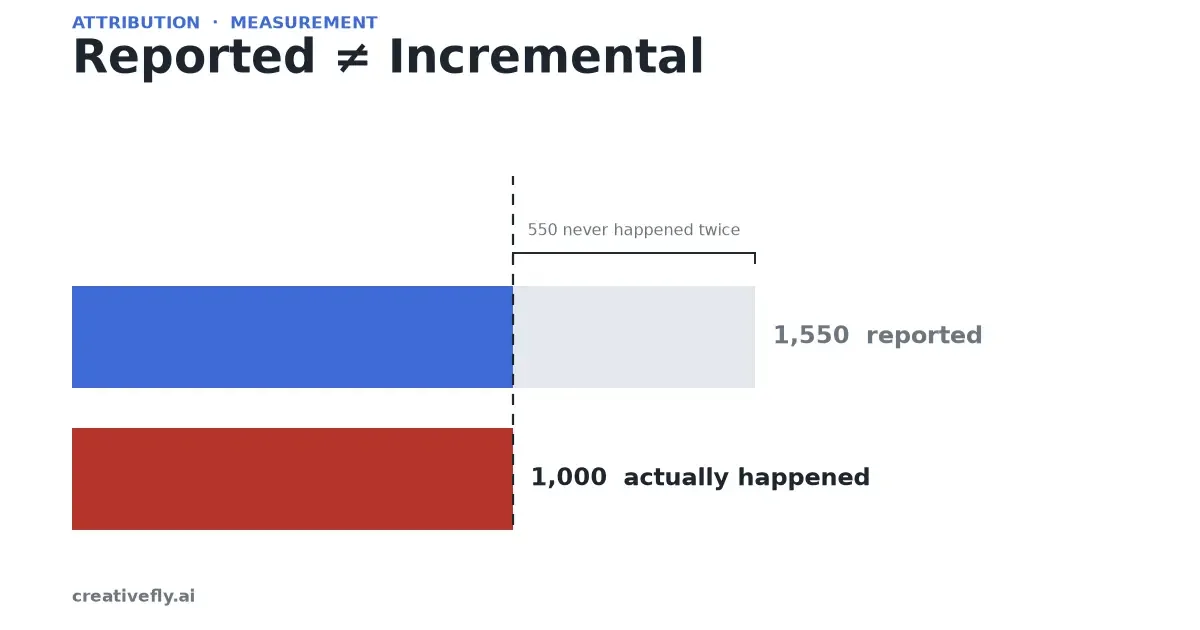
You shift budget toward the channel whose dashboard looks best. Its purchases column is climbing, the ROAS reads well, and the number is easy to point at in a meeting. Almost nobody asks the harder question in that moment: would those orders have happened anyway? The figure you are steering with counts conversions the platform chose to credit. It is not a measurement of the sales your ads caused.
What the number actually counts
A platform reports a conversion when an action lands inside an attribution window the platform defines for itself: someone clicked or recently saw your ad and later converted. Google's own documentation for geographic-lift work is unusually blunt about what that means for measurement. Its guidance states "using attributed data is strongly discouraged in GeoX because the attribution logic will bias the actual causal measurement," and asks you to supply "raw, unfiltered, and unattributed conversion or revenue data" from your own CRM or POS (source).
That line, written by the company that sells the attribution, deserves a second read. The dashboard answers "how many conversions happened within this window after an interaction?" It does not answer "how many of them would not have happened without the ad?" The gap between those two questions is the entire subject of this post.
The word that closes the gap: incremental
Measurement work calls the second number incremental conversions, and its definition is a counterfactual one. Google's Meridian GeoX glossary describes an incremental conversion as "the lift in business results, such as transactions or revenue" attributable to the campaign, "calculated using counterfactual modeling" (source). Counterfactual means you compare what happened with the ads running against a credible model of what would have happened with them off. Attribution never does that: it assigns outcomes that already occurred to earlier touchpoints; it never imagines the world where the ad did not run.
This distinction matters more now than it used to, because so much buying is automated. As campaigns consolidate into black-box systems, the platform number is often the only one you can see, and it is the number the system optimizes toward. You end up steering spend with a figure that, by construction, assumes its own contribution.
Why several "good" numbers still double-count
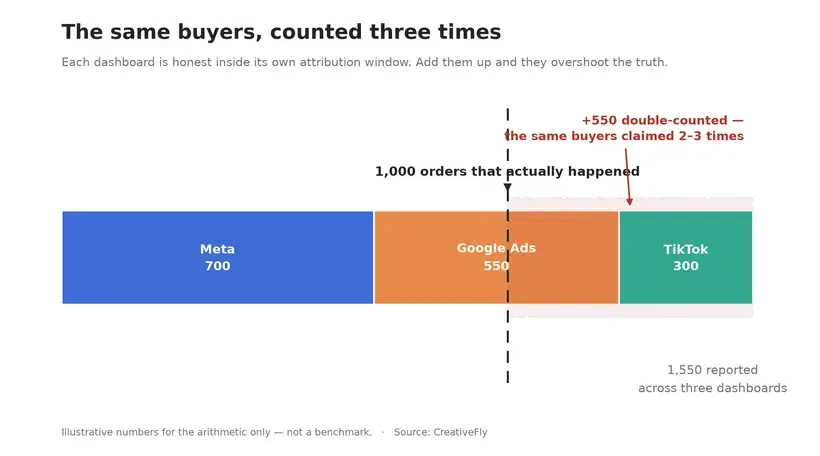
Suppose, purely for illustration, that your store logs 1,000 real orders in a week. Meta reports 700 attributed purchases, Google reports 550, and TikTok reports 300. Each figure can be individually honest, yet they sum to 1,550, more than the orders you actually had. The overlap is the cause: the same customer who saw a short video, clicked a search ad, and bought after a social ad is counted by all three systems. Platform-reported conversions are per-platform truths, not one shared ledger, so adding them across channels almost always overstates. (The numbers here are invented to show the arithmetic, not a benchmark.)
A ladder for deciding what is good enough
Not every decision deserves a lift test. Match the evidence to the size and reversibility of the bet.
| The decision in front of you | Evidence that can be enough | What that evidence still cannot tell you |
|---|---|---|
| Should I try this new creative at all? | A platform-reported trend, read directionally | Whether the lift was caused or would have happened anyway |
| Should I hold this channel's spend steady? | Attributed results plus guardrails like CPA and contribution margin | The channel's true incremental return |
| Should I move a large, hard-to-undo budget? | A holdout or geographic lift test | Nothing, if you skip the test and trust the dashboard |
The point of the ladder is that a reported conversion count is genuinely useful at the bottom two rungs. It becomes risky only when you let it settle the top one, where the cost of being wrong is large and the reversal is slow.
How a geographic lift test answers the real question
A geographic experiment turns your market into a natural experiment. You pick test regions where the campaign runs and control regions where it does not. The controls supply the baseline: Meridian's glossary defines control geos as "the group of geographic units that doesn't receive the marketing intervention, serving as the baseline" (source). You then compare what actually happened in the test areas against a model of what would have happened there, fitted from their own pre-campaign history.
Two design choices decide whether you can trust the result.
Split along real boundaries. The same glossary warns you to "Select your geographic units to minimize spillover effects between regions," steering clear of areas that share "well-known commuting patterns," because people travelling between a test and a control region leak activity across the line and blur the comparison (source).
Design for statistical power, not convenience. These are not casual tests. Google describes GeoX as an "open-source incrementality solution" that runs "transparent, cost-effective, and publisher-agnostic Geo experiments," using "time-based regression and stratified sampling" to "maximize statistical power" (source). Meta's counterpart, GeoLift, measures "Lift at a Geo-level" with synthetic control methods and ships "a variety of Power Calculators" for choosing how many markets to treat (source). Power calculators exist precisely because market selection is an analysis, not a guess.
Notice who built both tools. The two companies that profit most from their own attribution numbers also published incrementality frameworks, and Google, in its own words, advised against using platform-attributed conversions for causal work. That convergence is a fact you can use: treat the dashboard figure as directional, and keep a counterfactual method ready for decisions big enough to deserve one.
The honest limit, when a small account cannot run this
A geographic test needs enough comparable regions, enough pre-campaign history, and weeks to resolve cleanly. It assumes volume. If your budget is small or you operate in a single market, you may not be able to power a read you would trust, and the platforms' focus on power calculations is a quiet admission that underpowered tests produce confident-looking noise. So do not fake a geo study you cannot staff. Prefer the simpler designs you can actually run: a single-region market holdout where you pause the channel in one comparable area, a turn-on / turn-off comparison over time, or a creative A/B that at least isolates the message even though it does not isolate incrementality. And separate two things you might otherwise blur into one: the most you are willing to risk if the number is wrong, and a statistical conclusion about lift. Those are different decisions with different thresholds.
Before you move budget on a reported number
A short checklist, mostly questions you can answer today:
- What attribution window is this count using, and would a longer or shorter window change the story?
- Do several channels claim overlapping conversions? Compare the sum of their reported purchases to your actual order count.
- Is the figure revenue, contribution profit, or gross attributed sales? Attributed sales are not incremental sales, and neither one is profit.
- For a big, hard-to-reverse move, is there any counterfactual evidence at all, even a rough holdout?
- What is my stop-loss if the platform's number overstates the true lift?
The useful next decision is not "which dashboard looks best." It is "how large is this bet, and what would it take to know the lift was real?" For a small, cheap test, the dashboard is probably enough. Before a large, budget-shifting move, run a holdout first, because the number you can see and the number that caused it are, by design, two different things.